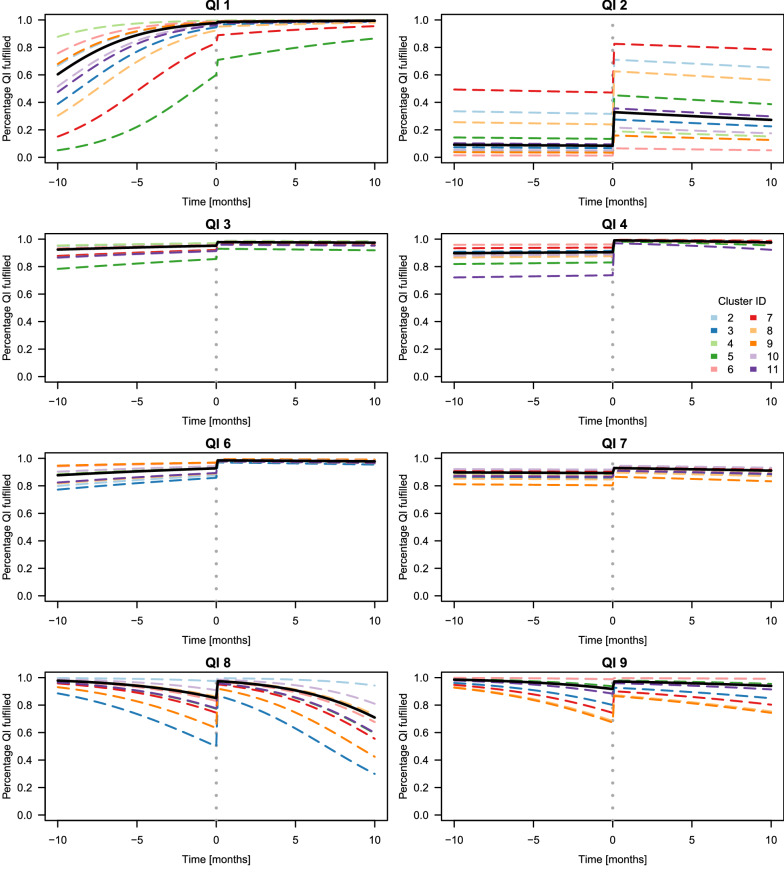
Fig. 2.
Mean QI adherence [percentages] over time before and after implementation of the intervention (model-based principal analysis for each patient QI). Black continuous lines display the global (marginal) effect (fixed effects without random effects) for each QI. Coloured dashed lines display the fixed effects and cluster-specific intercepts (without patient-specific intercepts). Vertical dashed grey line: actual switch from control to the intervention period. For QI 4 and QI 6, the principal model could not estimate the variance component for the cluster-specific intercepts (due to lack of variability). Therefore, estimates of the sensitivity analysis model SM.5 are displayed (see Appendix for further details)

