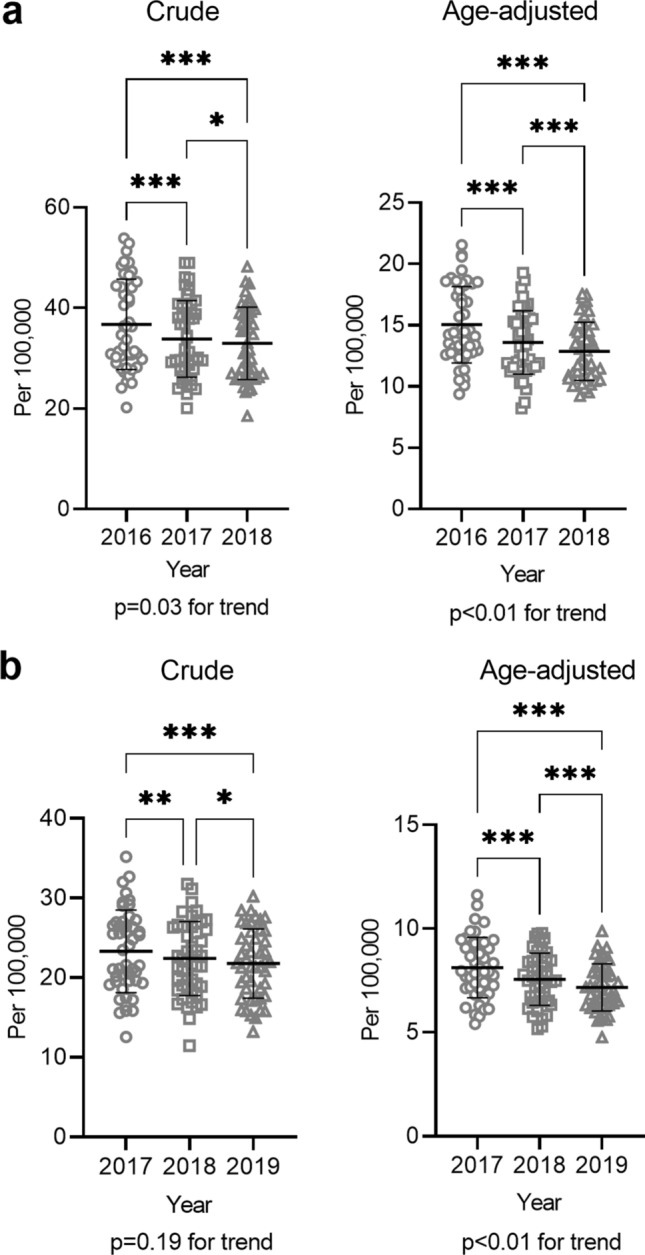
Fig. 2.

Indicators related to morbidity and mortality from liver cancer (S4, S5). a S4 The crude (left) and age-adjusted (right) incidences of liver cancer per 100,000 population were plotted for each prefecture for each fiscal year. b S5 The crude (left) and age-adjusted (right) mortality rates from liver cancer per 100,000 population was plotted for each prefecture for each fiscal year. *P < 0.05, **P < 0.01, ***P < 0.001, ****P < 0.0001. ns not significant; error bars show standard deviation
