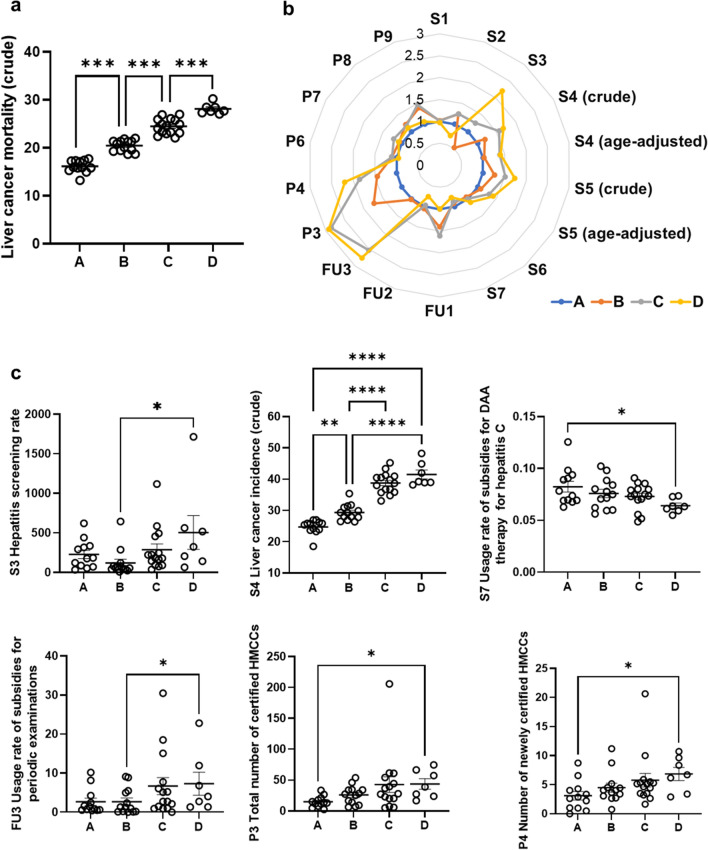
Fig. 5.
Performance indicators related to crude liver cancer mortality in 2019. S5 Crude liver cancer mortality was divided into four groups based on the mortality rate in 2019. A = less than 18, 12 prefectures; B = 18–22, 13 prefectures; C = 22–27, 15 prefectures; D = more than 27, 7 prefectures. The differences between groups were analyzed by one-way analysis of variance. a histogram was generated to compare the difference of several PIs among the four groups. PIs of groups B, C, and D were normalized to those of group 1, with group A PIs set to 1. S4 was the data from 2018, and the other PIs were from 2019. b Differences in several PIs, including S3 (HBV), S4, S7, FU3, P3, and P4, between groups were analyzed by one-way analysis of variance. S4 was the data from 2018, and the other PIs were from 2019. *P < 0.05, **P < 0.01, ***P < 0.001, ****P < 0.0001. ns not significant; error bars show standard error

