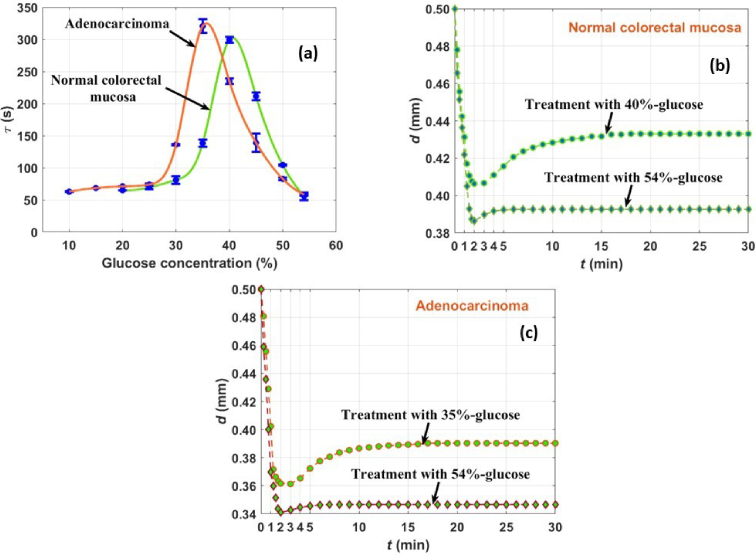
Fig. 16.
Mean τ as a function of glucose concentration in the treating solution (a) and mean sample thickness kinetics of the normal mucosa (b) and of the adenocarcinoma (c) for different treatments. Adapted with permission from Ref. [132], which was published under Creative Commons license, SPIE.

