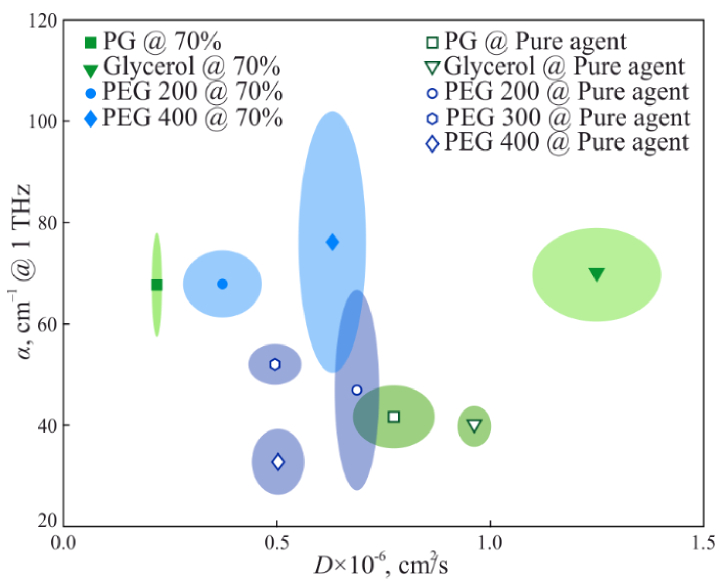
Fig. 21.
A nomogram that compares immersion OCAs and their 70% aqueous solutions, considering the experimental data of their THz absorption coefficients α (by field) at 1.0 THz and binary diffusion coefficients D (into rat brain tissues ex vivo). Mean values are shown by markers, while measurement errors – by colored areas. Reprinted from Ref. [221] with the permission of Wiley.

