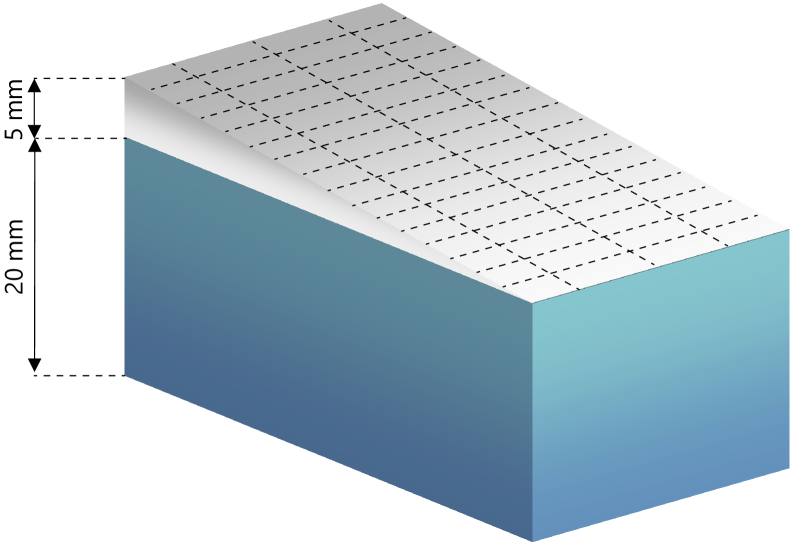
Fig. 4.
Schematic representation of the bilayer phantom. The top layer thickness varies from 0 to 5 mm, which results in a variable distance from the measurement surface to the bottom layer with Methylene blue. The intersections between the dashed lines on the phantom surface represent the different measurement locations, in a grid pattern.

