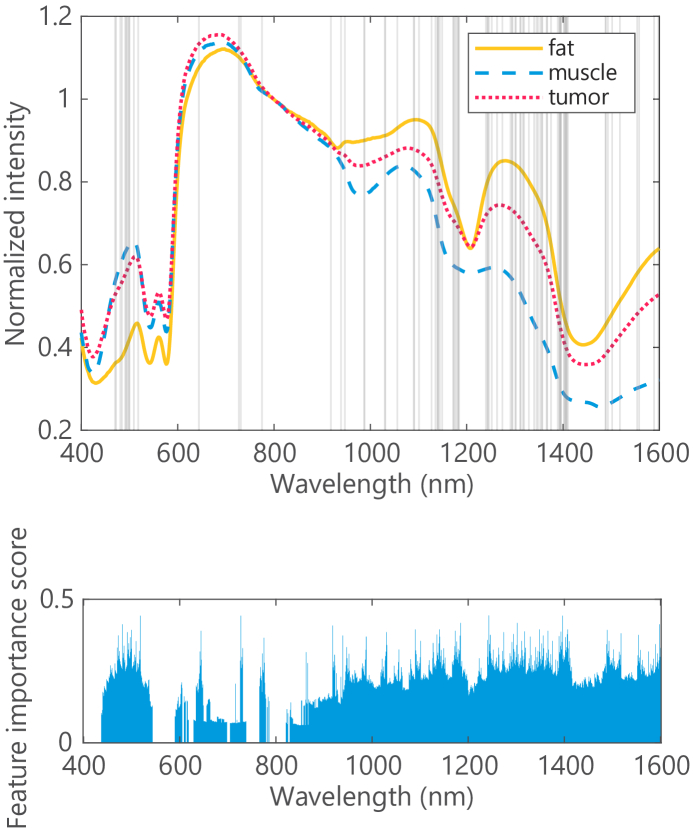
Fig. 13.
Top: Mean DRS spectra for fat, muscle and tumor tissue, acquired with the side-firing optical probe in ex-vivo colorectal cancer specimens. The grey lines highlight the 90 most important wavelengths that were selected using MRMR analysis. Bottom: Feature importance scores of MRMR analysis for every wavelength.

