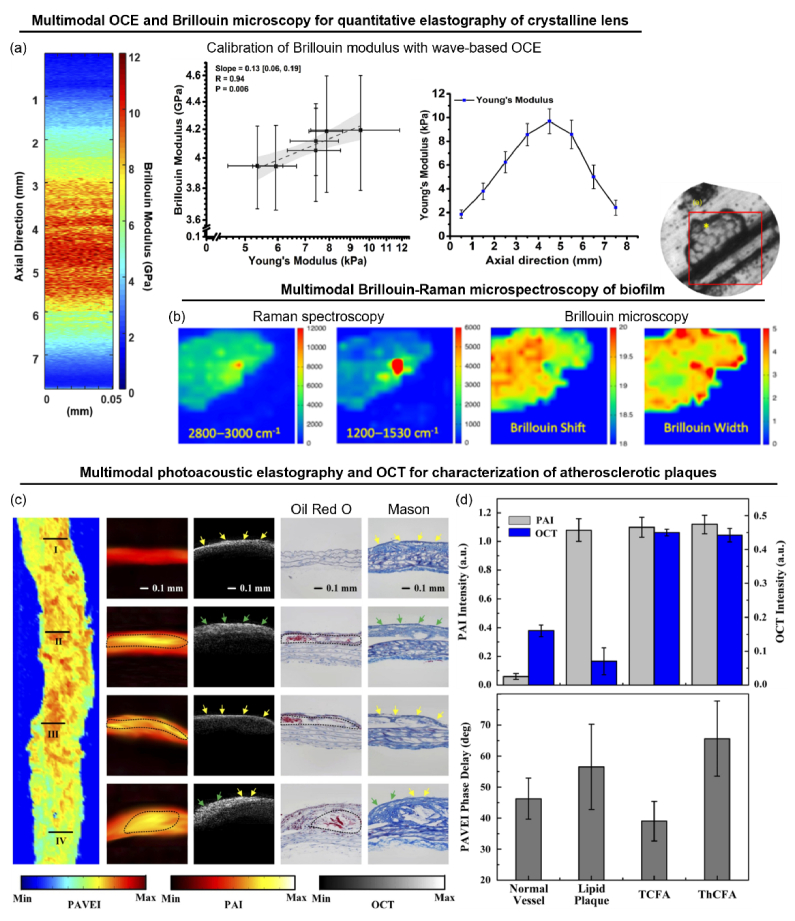
Fig. 9.
Multimodal optical elastography platforms. (a) 3D BM (left) and Brillouin-to-Young’s modulus calibration with wave-based OCE (middle) enables 3D elasticity imaging of crystalline lens (right). (b) BM and Raman spectroscopy enables simultaneous imaging of viscoelasticity and biochemical signatures in microbial biofilms. Regions of high Raman intensity may represent overlapping of cells and increased retention of water, which correspond to regions of low Brillouin shift (elasticity) and high Brillouin peak width (viscosity). (c) Photoacoustic viscoelasticity imaging (PAVEI), PA imaging (PAI), and OCT enables simultaneous characterization of atherosclerotic plaque relative viscosity, lipid core area (black dotted region, corroborated by Oil Red O staining), and fibrous cap thickness (yellow and green arrows for thin and thick caps, respectively, corroborated by Mason staining). (d) PAI intensity, OCT intensity, and PAVEI phase delay (relative viscosity) can distinguish different types of plaques during the progression from early-stage lipid plaque to middle-stage thin-cap fibroatheroma (TCFA) to late-stage thick-cap fibroatheroma (ThCFA) at the risk of rupture. Adapted with permission from: (a) [120], (c) and (d) [129] © Optica, (b) [177] © APS.

