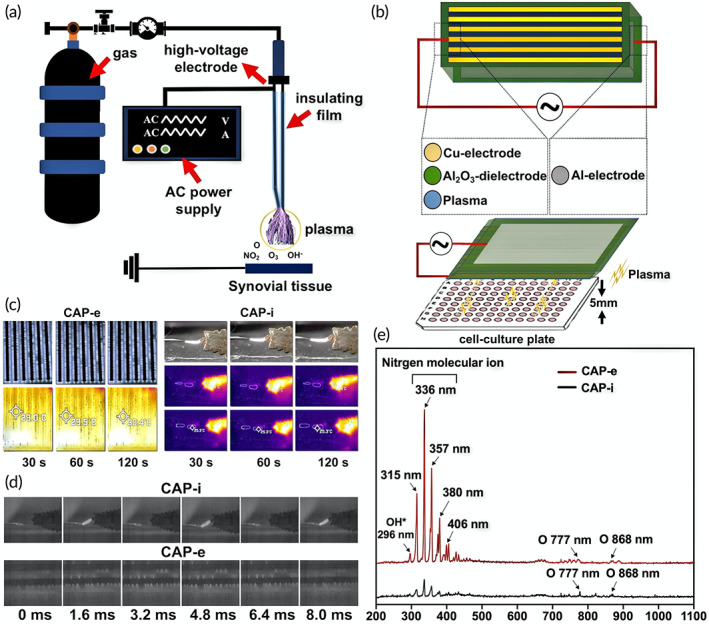
FIGURE 1.

Illustration of cold air plasma (CAP) devices and physical characteristics of plasma. (a) Schematic diagram of CAP‐i device. (b) Schematic diagram of CAP‐e device. (c) The infrared thermometer measures the working temperature of CAP‐i and CAP‐e device at different times. (d) The discharge image was recorded by means of a high‐speed camera device (phantom) with 600 frames per second. (e) Emission spectra of CAP‐i and CAP‐e between 200 and 1100 nm
