
FIGURE 3.
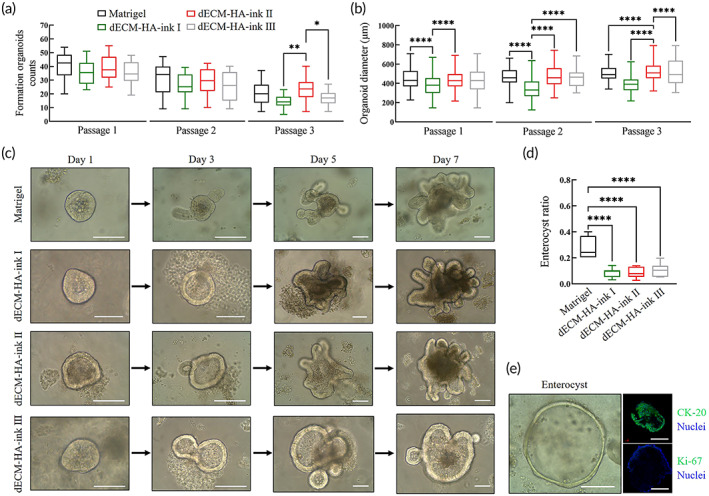
Culture of mouse small intestinal organoids in decellularized extracellular matrix (dECM)‐based bioinks and Matrigel. (a) Formed intestinal organoids per field of view at 100× at Day 7 of three consecutive passages. Mean ± S.D. (n = 16 from four organoids cultures). One‐way ANOVA. *p < 0.05 and **p < 0.01. (b) Analysis of organoids diameters at Day 7 of three consecutive passages. Mean ± S.D. (n = 80 from four organoids cultures). One‐way ANOVA. ****p < 0.0001. (c) Typical bright field images of formed organoids at Days 1, 3, 5, and 7 at first passage within bioinks and Matrigel. Scale bar 100 μm. (d) Collective ratio of formed enterocysts to cell aggregates at Day 7 of Passage 1. Mean ± S.D. (n = 7 organoids cultures). One‐way ANOVA. ****p < 0.0001. (e) Typical bright field image and immunofluorescence analysis of an enterocyst with Matrigel. Showing villi enterocyte marker CK‐20 and proliferation marker Ki‐67. Scale bar 100 μm