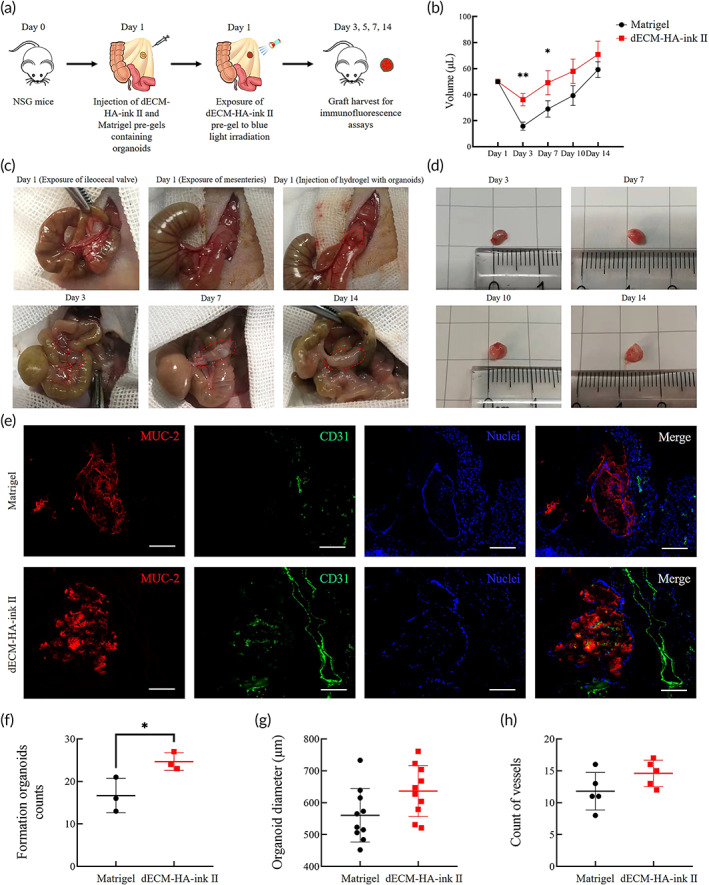
FIGURE 8.

Transplantation of dECM‐HA‐ink II and Matrigel pregels containing organoids into the NSG mice mesentery. (a) Schematic diagram shows the transplantation process using an animal model of NSG mice. (b) Calculated volume of the grafts harvested on Days 3, 7, 10, and 14, respectively. Mean ± S.D. (n = 3). Two‐sided t‐test. *p < 0.05 and **p < 0.01. (c) Typical images showing the whole procedure of injection and growing graft. (d) Typical images showing harvested grafts on different days after transplantation with increasing size from decellularized extracellular matrix (dECM) group. (e) Frozen sections of matured organoids within the grafts. Showing MUC‐2 and small vessel marker CD31. Scale bar 100 μm. (f) Analysis of the numbers of formed counts on frozen sections from different grafts harvested on Day 14. Mean ± S.D. (n = 3 grafts). Two‐sided t‐test. *p < 0.05. (g) Analysis of organoids diameters according to the frozen sections of grafts harvested on Day 14. Mean ± S.D. (n = 10). (h) Analysis of the numbers of formed small vessels on frozen sections from different grafts harvested on Day 14. Mean ± S.D. (n = 5 grafts)
