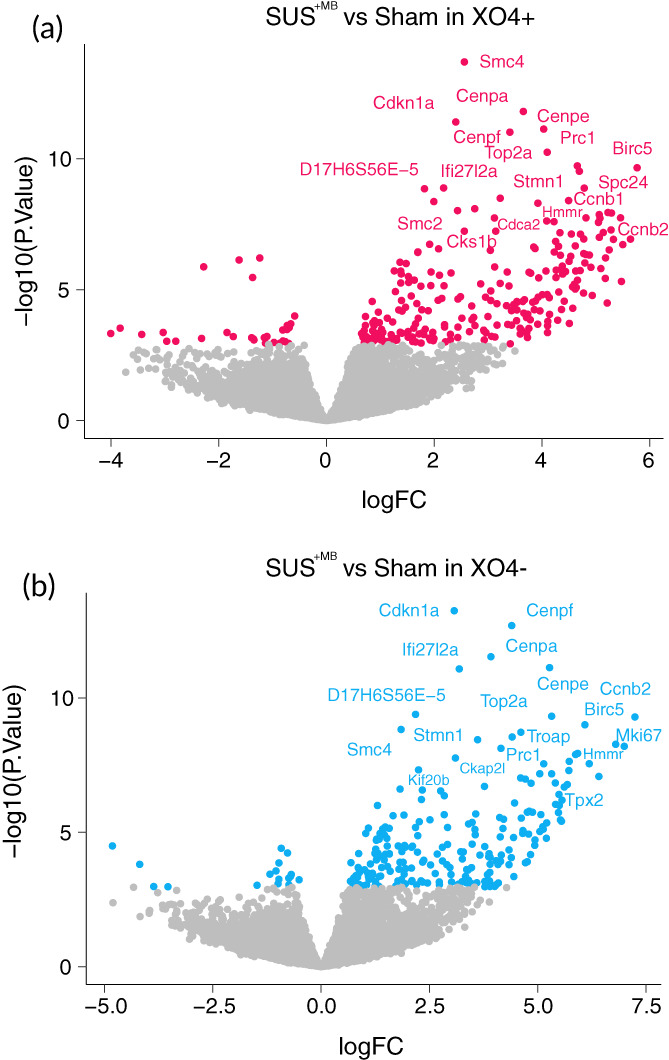
FIGURE 4.

Volcano plots reveal dysregulation of genes in microglia from APP23 mice following SUS+MB or sham treatment. (a) XO4+ microglia show a large number of up‐regulated genes. The gene names of the 20 transcripts with the largest fold‐change (logFC) are shown. (b) XO4− microglia also show a large number of up‐regulated genes. The gene names of the 20 transcripts with the largest fold‐change (logFC) are shown.
