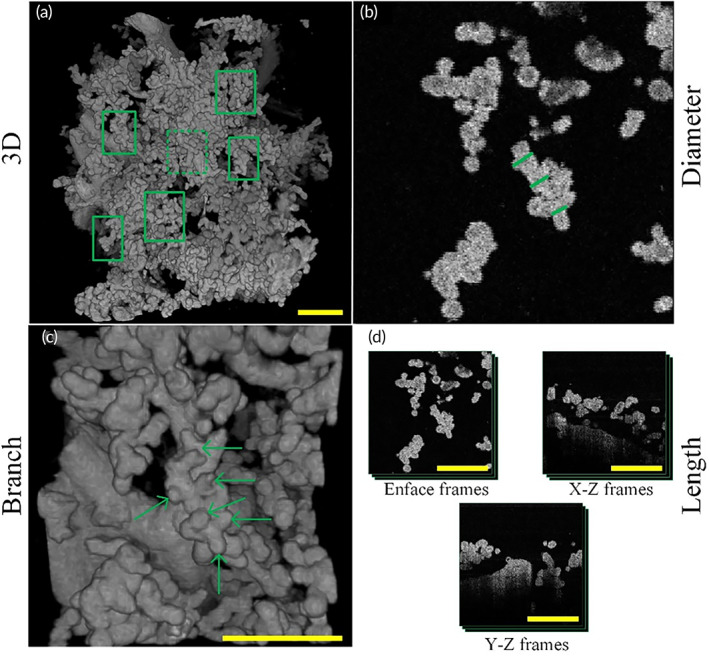
FIGURE 3.

Schematic diagram of placenta villi quantification. (a) Schematic diagram of placenta villi sampling locations. Six villi were selected to quantify villi morphological parameters indicated by green boxes in a 3D OCT image of placental villi. (b) Diameter quantification of placenta villi. Green lines in OCT enface image corresponding to the region of green dashed box in (a) indicate villi diameter quantification sampling location. Three locations of every intermediate villus were selected. (c) Villi branches quantification of placenta villi. 3D OCT image of placenta villi corresponding to the region indicated by the green dashed box in (a). Six green arrows indicate six branches of the intermediate villi in this view. We also perform the rotation in 3D to count villi branches more accurately. (d) Length quantification of placenta villi. Frame numbers where quantified villi appeared were counted in three different cross‐sections. OCT, optical coherence tomography
