
FIGURE 8.
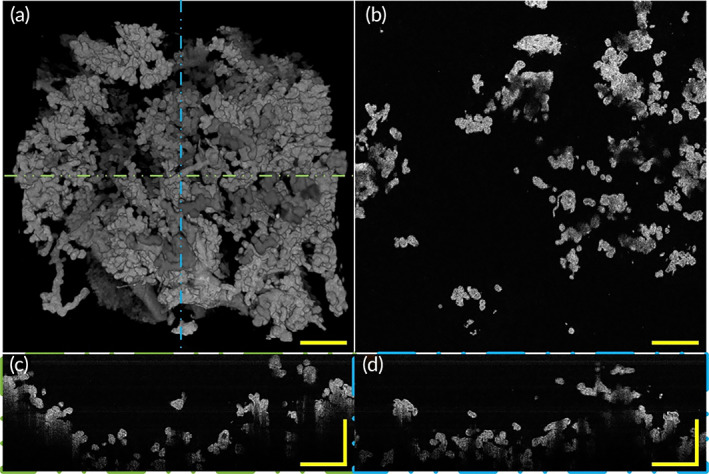
3D morphology and section images of placenta villi with GDM via OCT. (a) Top view of 3D OCT morphology shows villous trees of placenta with GDM were well‐branched. (b) A representative OCT en‐face section image of placental villi with GDM. (c) A representative rescaled B‐scan section image of placental villi corresponding to the position indicated by the green line in (a). (d) A representative rescaled B‐scan section image of placental villi corresponding to the position indicated by the blue dashed line in (a). All scale bars are 500 μm. GDM, gestational diabetes mellitus; OCT, optical coherence tomography