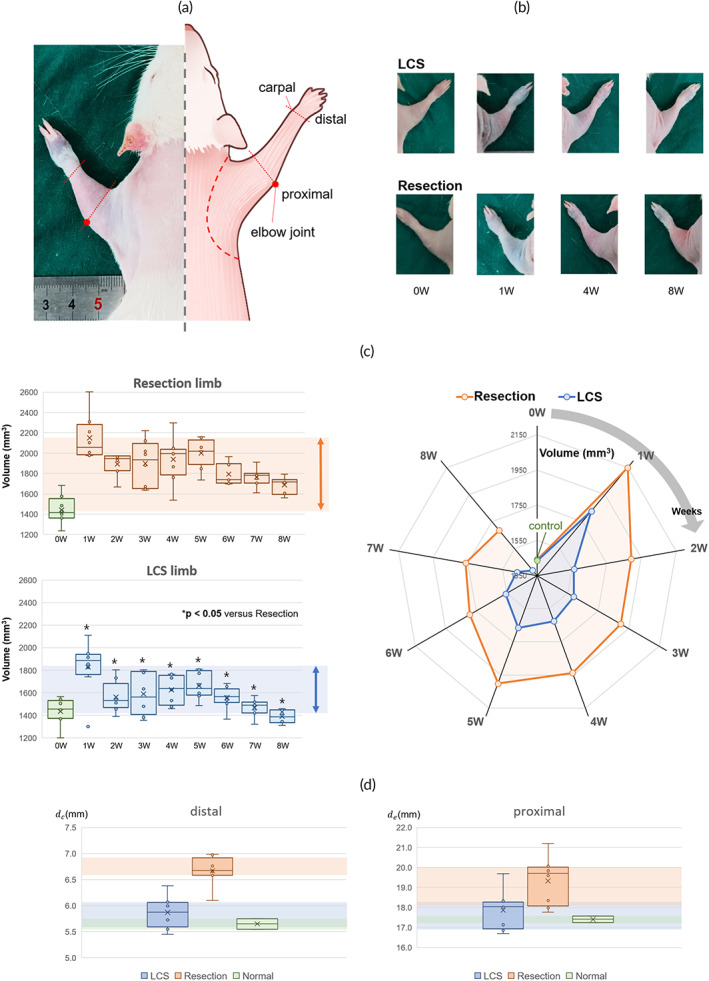
FIGURE 6.

(a) The anatomical reference for volume measurement and (b) the images of each limb to measure the diameter using the ImageJ software. (c) The change of the volume in both lymphatic channel sheet (LCS) and resection limb for 8 weeks. The colored background presents the fluctuation range of the volume change. There was a significant difference between the LCS and resection limb in all follow‐up periods. *p < 0.05 versus the volume of resection limb based on ANOVA. The radar graph presents the difference between the volume of the LCS and resection limb each week. The LCS limb returned to near normal values in the eighth week. (d) The box and‐whisker diagram of diameter in the distal area (carpel) and proximal area (from elbow to cubital fossa) during 8 weeks. The resection limb had a significant difference compared to the normal limb, but the difference in the distal area was more pronounced. There was no significant difference in the LCS limb compared to the normal limb. The colored background presents from Q1 (the median of the lower half of the dataset) to Q3 (the median of the upper half of the dataset) in the box plot.
