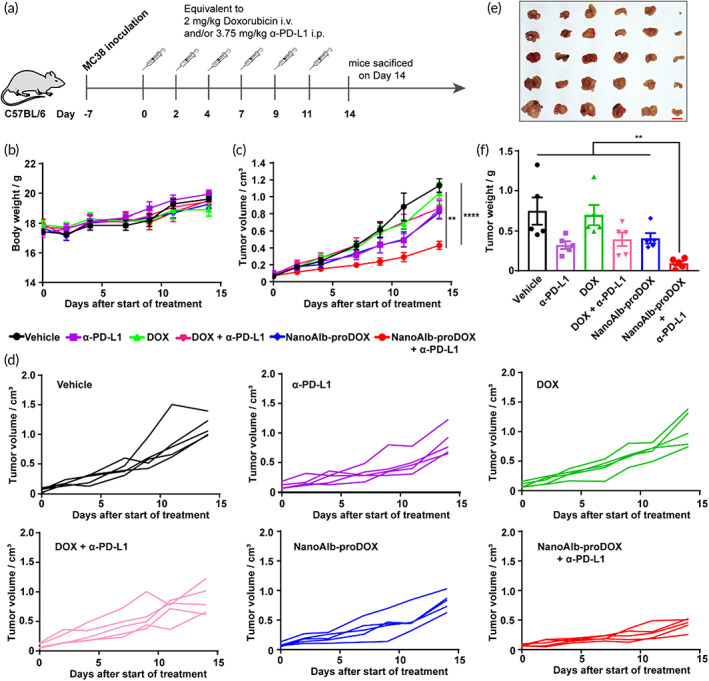
FIGURE 5.

NanoAlb‐proDOX synergized with immune checkpoint blockade. (a) Schematic representation of the design of animal experiments. Drugs were administered on the indicated days intravenously or intraperitoneally and sacrificed on Day 14. (b) Body weight curves. (c) Average tumor volume curves. Mice were randomly divided into six groups. Body weights and tumor volumes were measured every 2 or 3 days from Day 0 to Day 14. (d) Individual tumor growth curves of the six groups of mice. (e) Images of the tumor tissues. Scale bar: 1 cm. (f) Weights of the collected tumor tissues; (e) and (f) used the same group labels. Data are presented as the mean ± SEM. n = 5 mice for each group. **p < 0.01, ****p < 0.0001
