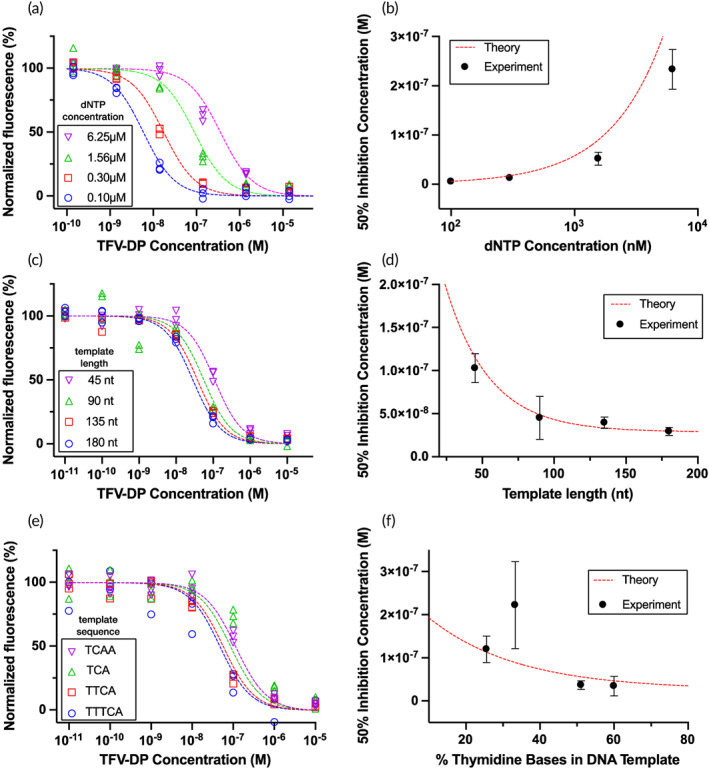
FIGURE 3.

Effect of nucleotide concentration, template length, and template sequence on detection of TFV‐DP using the RESTRICT assay. (a) As dNTP concentration increases, RESTRICT curves shift to higher TFV‐DP concentrations. (b) As dNTP concentration increases, IC50 increases. (c) As template length increases, RESTRICT curves shift to lower TFV‐DP concentrations. (d) As template length increases, IC50 decreases. (e) As the thymidine base content of DNA templates increases, RESTRICT curves shift to lower TFV‐DP concentrations. (f) As thymidine content increases, IC50 decreases. Symbols indicate experiments and dashed lines indicate theory. N = 3. Error bars indicate 95% confidence intervals
