
FIGURE 4.
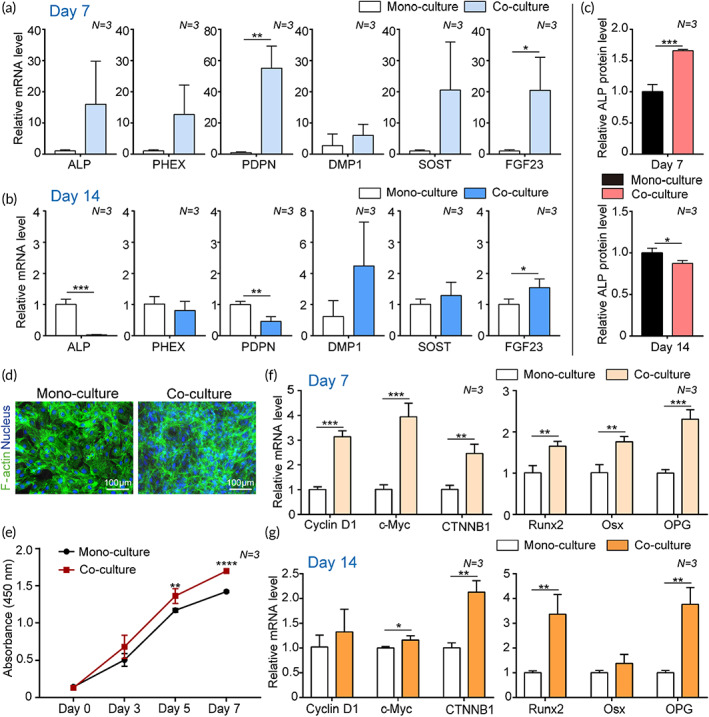
Effect of osteocyte and osteoblast coculture in a bone‐on‐a‐chip. (a–c) The osteocyte differentiation of IDG‐SW3 cells was affected upon coculture with MC3T3‐E1 cells. Relative gene expression levels of early differentiation markers (ALP, PDPN, and PHEX) and late differentiation markers (DMP1, SOST, and FGF23) in IDG‐SW3 cells monocultured or cocultured with MC3T3‐E1 cells on (a) Day 7 and (b) Day 14 after culture (N = 3). GAPDH was used as an internal control. (c) The ALP protein level of IDG‐SW3 cells in mono or cocultured groups measured using an ALP quantification assay on Day 7 and Day 14 after culture (N = 3). (d–g) The proliferation and osteoblastogenic differentiation of MC3T3‐E1 cells was affected upon coculture with IDG‐SW3 cells. (d) Representative immunofluorescence images showing staining against F‐actin (green) and nucleus (blue) of MC3T3‐E1 cells in monoculture or coculture groups on Day 7. (e) Proliferation rate of MC3T3‐E1 cells cocultured with IDG‐SW3 cells during 7 days measured using a CCK‐8 assay (N = 3). (f and g) Relative gene expression levels of proliferation markers (Cyclin D1, c‐Myc, and CTNNB1) and osteoblast differentiation markers (Runx2, Osx, and OPG) in MC3T3‐E1 cells monocultured or cocultured with IDG‐SW3 cells on (f) Day 7 and (g) Day 14 after culture (N = 3). GAPDH was used as an internal control. All values are expressed as mean ± SD (*p < 0.05, **p < 0.01, ***p < 0.001, ****p < 0.0001). CCK‐8, Cell Counting Kit‐8