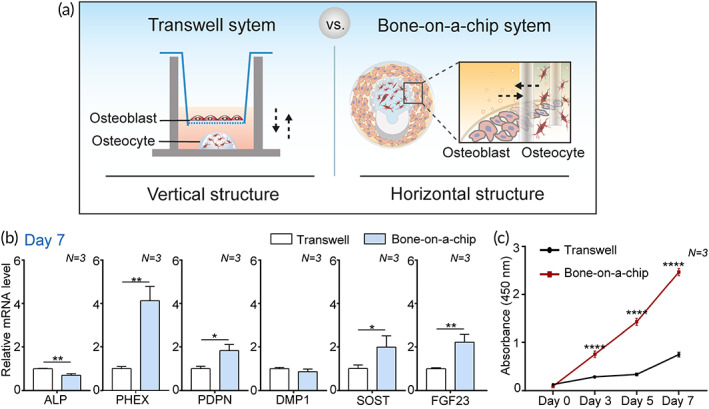
FIGURE 5.

A comparison of the contribution of a bone‐on‐a‐chip and a Transwell system to bone maturation in osteocytes and osteoblasts. (a) Schematic illustration showing the difference in spatial structure between a bone‐on‐a‐chip and a Transwell system for coculturing osteocytes and osteoblasts. (b) Relative gene expression levels of early osteocyte markers (ALP, PDPN, and PHEX) and late osteocyte markers (DMP1, SOST, and FGF23) in IDG‐SW3 cells in each system on Day 7 (N = 3). IDG‐SW3 cells embedded in gel (1 × 10⁴ cells in 10 μl gel) were cocultured with osteoblasts (500 cells/well). All conditions were the same in both systems. GAPDH was used as an internal control. (c) Proliferation rate of MC3T3‐E1 cells cocultured with IDG‐SW3 cells during 7 days measured using a CCK‐8 assay (N = 3). All values are expressed as mean ± SD (*p < 0.05, **p < 0.01, ****p < 0.0001). CCK‐8, Cell Counting Kit‐8
