
FIGURE 5.
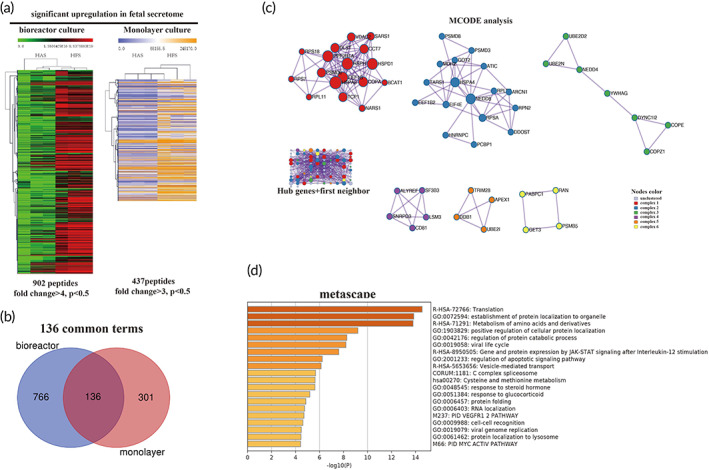
ITRAQ analysis revealed that the exosome, Heat‐shock proteins, and 14‐3‐3 proteins family play a core role in the fetal enriched proteins (FEP) network. (a). The expression heatmap of differentially expressed proteins (DEPs). The genes were pre‐selected base on Wilcoxon signed‐rank test. Only significantly highly expressed proteins (p < 0.05)were included in the heatmap. Rows represent individual proteins identified and relatively quantified by iTRAQ. Columns represent the individual samples. For bioreactor culture, the intensity scale is green, black and red. Green indicates lower and red higher expression in protein level. For monolayer culture, the intensity scale is blue, white, and yellow. Blue indicates lower expression and yellow higher expression of individual protein. The Rows and columns of the heatmaps are clustered based on Euclidean metric. Secretome from adult and fetal cells were successfully clustered together to each groups respectively. HAS: human adult secretome. HFS: human fetal secretome. Totally, 902 peptides and 437 peptides were identified as highly expressed protein in HFS. (b). The Venn diagram showing that 136 FEPs (fetal expressed proteins) were shared by bioreactor culture and monolayer culture. (c). A hub network was constructed by Metascape, with default parameters, based on PPI (protein–protein interaction) data extracted from STRING. (Left‐lower panel), MCODE in Metascape analysis identified six complexes from this network. Red, blue, green, purple, brown, and yellow color represent various sub‐networks. The knots in each subnetwork represent genes while the line between them indicate physical interaction. The size of the nodes indicates the degree of freedom of each gene. The Larger nodes indicates more genes were linked to this node. Hub genes: genes consist of complexes 1–6. First neighbor: other genes in 136 shared genes except the hub genes. (d) GO (gene ortholog) enrichment analysis was used to identify the biological meaning of the hub network. The statistically differentially expressed pathway was listed based on significant ranking. The Darker brown color represents the higher significance of each term. The bars represent the significance of the terms.