
FIGURE 6.
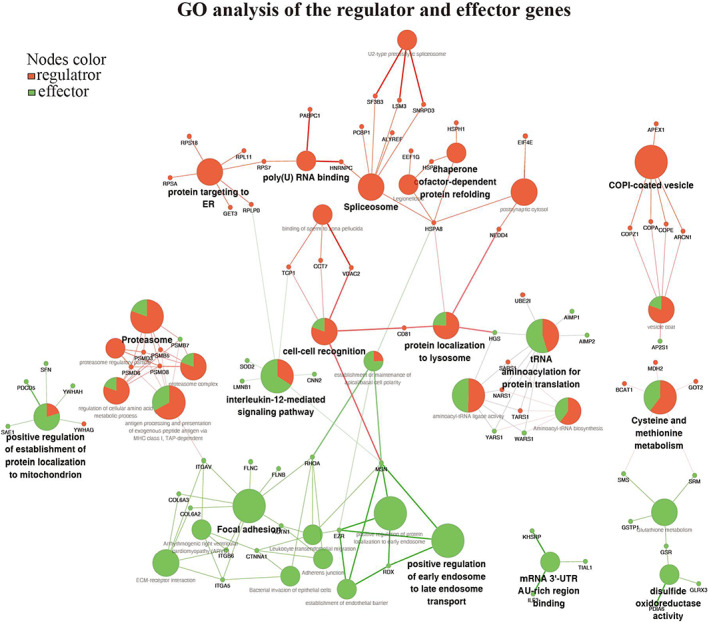
Gene ortholog (GO) network of regulator and effector genes. (a) ClueGO analysis was applied to the regulators and the effectors genes, respectively. The GO terms were shown as nodes and linked based on the kappa score (≥0.3). Only the most significant proteins enriched in each term were shown in the plots. The node size represents the enrichment significance. The red color represents the regulator proteins, the green color represents the effector proteins. The proportions of the two types of genes in mixed terms was visited as green and red color in one node. The distribution of two groups visualized on network based on their kappa score level (≥0.3), where only the label of the most significant term per group is shown as the smallest nodes. The larger node size represents the enrichment significance of this term