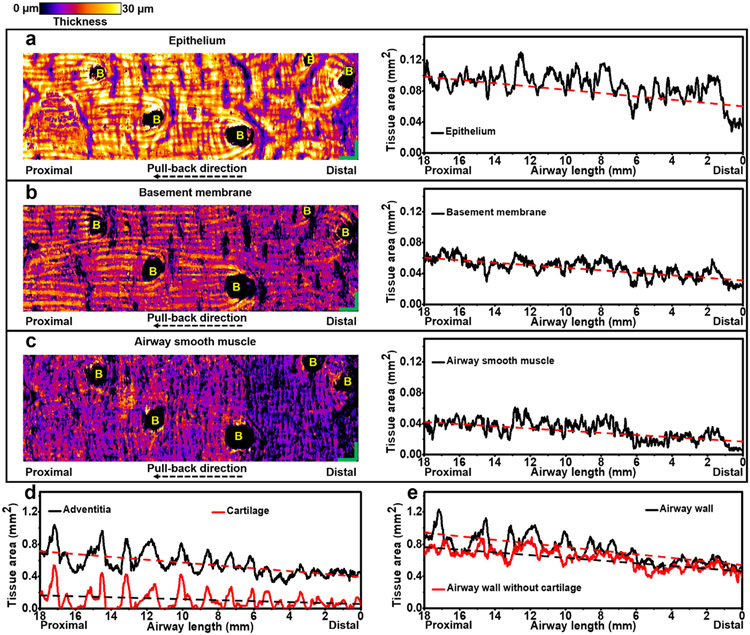
Fig. 6. Visualization and quantification of small airway tissue compartments.
(a-c) Unwrapped en face views of three tissue compartments in (n=1) representative 18-mm long sheep small airway with tissue thickness coded by color, including the epithelium (a), basement membrane (b), and airway smooth muscle (c). Quantifications of cross-sectional area of small airway tissue compartments, such as epithelium (a), basement membrane (b), airway smooth muscle (c), adventitia and cartilage (d), and airway wall with and without cartilage (e), are shown along the longitudinal airway lumen direction. The linear fitting lines (red and black dashed lines) in (a-e) indicate the increasing cross-sectional areas of each tissue compartment along the catheter pull-back direction (from distal to proximal end). 0 mm in the horizontal axes in (a-e) indicates the starting distal point of the pull-back OCT imaging. B: branch. Scale bars: 1 mm.

