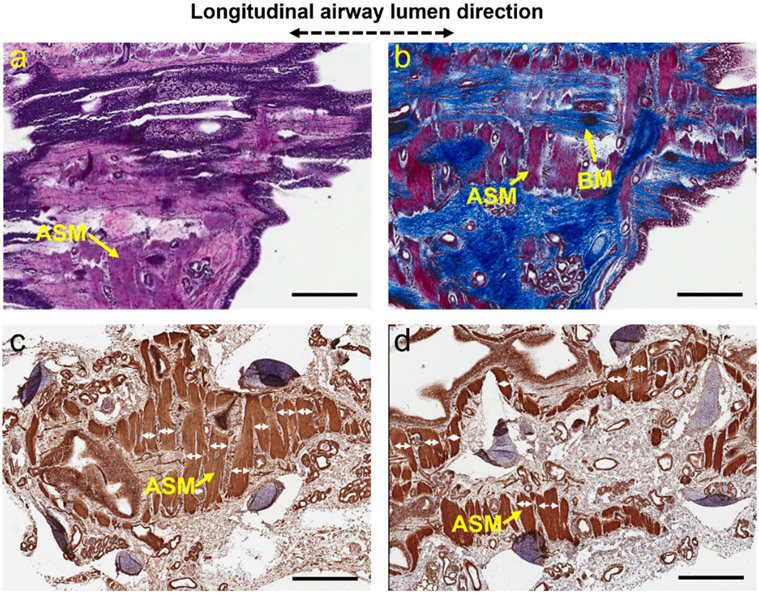
Fig. 7. 3D architectures of basement membrane and airway smooth muscle in sheep small airways.
(a, b) Two adjacent histological slides, which were stained with haemotoxylin and eosin (a) and Masson’s trichrome (b), respectively, show the volumetric architectural evolvement of basement membrane and airway smooth muscle at different depth. (c, d) Two adjacent histological slides stained with a smooth muscle actin stain (i.e., aSMA) to specifically visualize airway smooth muscle cells. Starting from the airway luminal surface, histological slides were sectioned in sequence along the longitudinal direction of the airway lumen with as close as possible orientation to en face OCT images. The histological slides shown in (a, c) were sectioned before those shown in (b, d). All these histological specimens were 10-μm thick. The band widths of airway smooth muscle (white double-headed arrows) can be measured directly on the histology micrographs. ASM: airway smooth muscle, BM: basement membrane. Scale bars: 1 mm.

