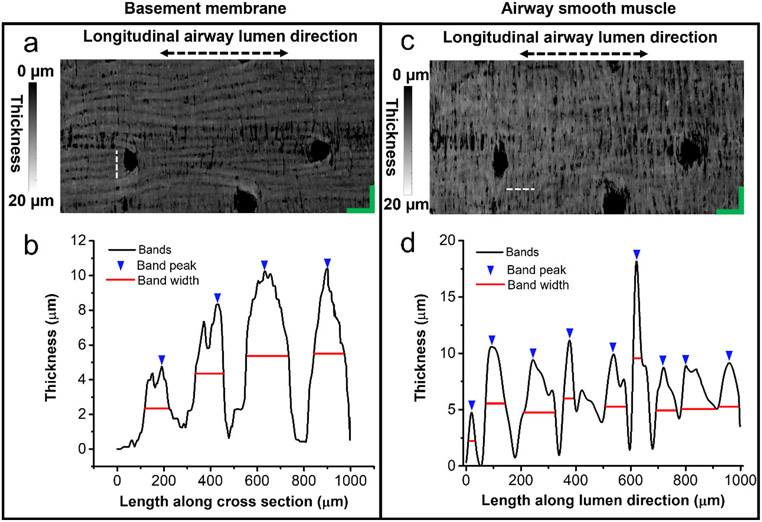
Fig. 8. Measuring band widths of basement membrane and airway smooth muscle in unwrapped en face OCT images.
(a, c) Representative en face images of basement membrane and airway smooth muscle with the tissue thickness encoded in gray level. Dashed lines: 1mm. (b, d) Thickness profiles from the 1-mm horizontal (for basement membrane) and longitudinal (for airway smooth muscle) cross-sections indicated with dashed lines in (a) and (c), respectively.

