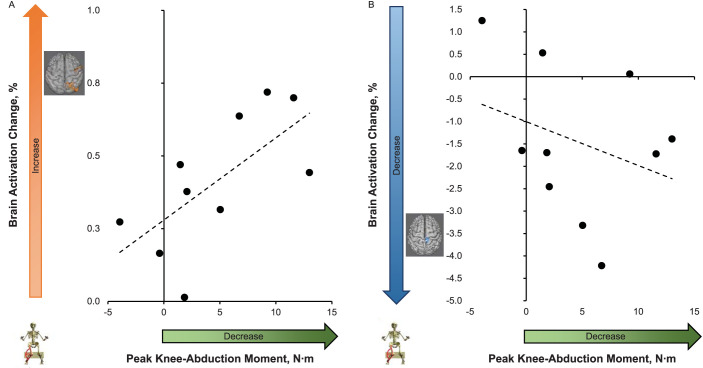
Figure 4.
Relationship between brain activation changes (% signal change of only voxels identified in Table 2 as different from preintervention to postintervention with respect to each motor task, y axis) and landing injury risk (peak knee-abduction moment [Nm]) difference from pre- to postneuromuscular training (x axis). Larger x-axis values indicate a greater decrease in knee-abduction moment from pretest to posttest. Larger y-axis values indicate an increase in brain activation and smaller values indicate a decrease in brain activation from pretest to posttest. A, Knee-task brain activity (averaged across all 3 identified clusters) increased. B, Multijoint leg-press task brain activity decreased across the 1 identified cluster.

