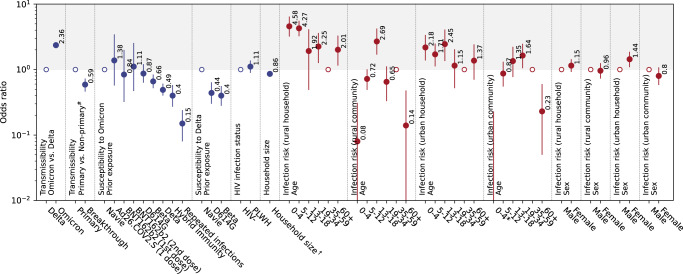
Fig. 3. Risk factors associated with SARS-CoV-2 Omicron BA.1/2 and Delta infection.
Odds ratios (adjusted after controlling for other risk factors, see Methods Section 4 for details) were estimated by a chain-binomial model fitted to the infection outcome of n = 905 participants, where the Omicron BA.1/2 and Delta infections was inferred by the serologic approach. Empty circles are reference classes. Solid dots and lines represent maximum likelihood estimate and 95% confidence intervals. Abbreviation: PLWH: persons living with HIV. Category “Unknown” for “HIV infection status” and category “Rest” in “Prior exposure” (Table 1) were included in the model but omitted here due to small sample size in the strata. *0-4 age group have odds ratio point estimate less than 0.01, thus not shown in the figure. #Non-primary infections represent repeat/breakthrough infections. †Household size denotes the number of household members within a household and is analyzed as a continuous variable.

