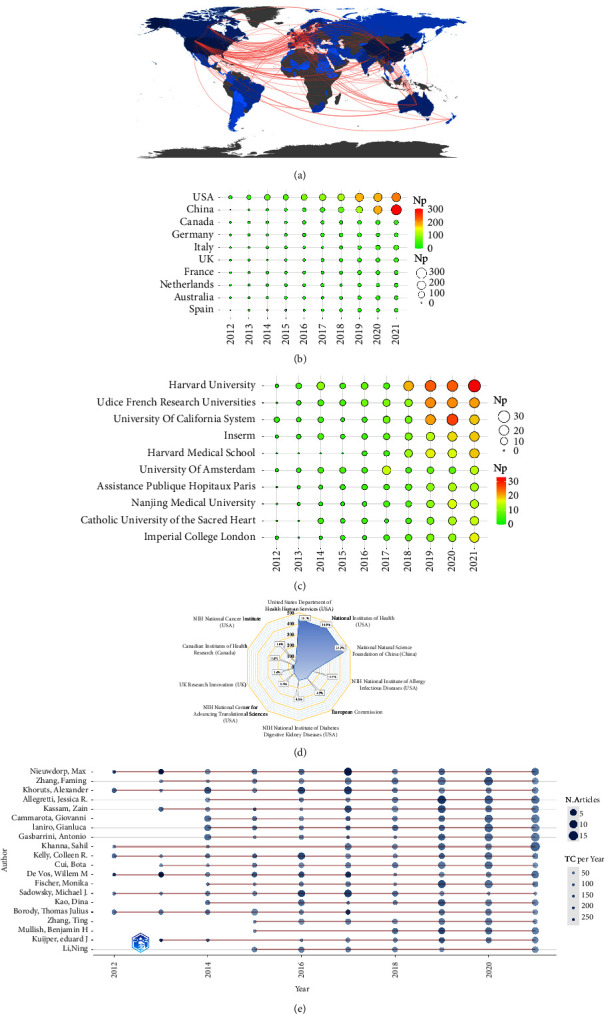
Figure 4.

(a) Global scientific output and international cooperation network (the shade of color represents the national output; the more intense the blue, the greater scientific production. Grey shows countries without scientific production; the red line shows the cooperation, the thicker the boundaries, the greater the cooperation degree). (b) Annual output of the top 20 high-prolific countries in FMT (the circle's size manifests the national output; the bigger the circle, the more publications). (c) Annual output of the top 10 high-prolific institutions in FMT. (d) The top 10 funding organizations in FMT research. (e) Annual output of the top 20 most prolific writers in FMT research throughout time (the circle's size symbolizes the output, with larger circles representing more output; the circle's depth symbolizes the annual citations, with darker colors representing more citations).
