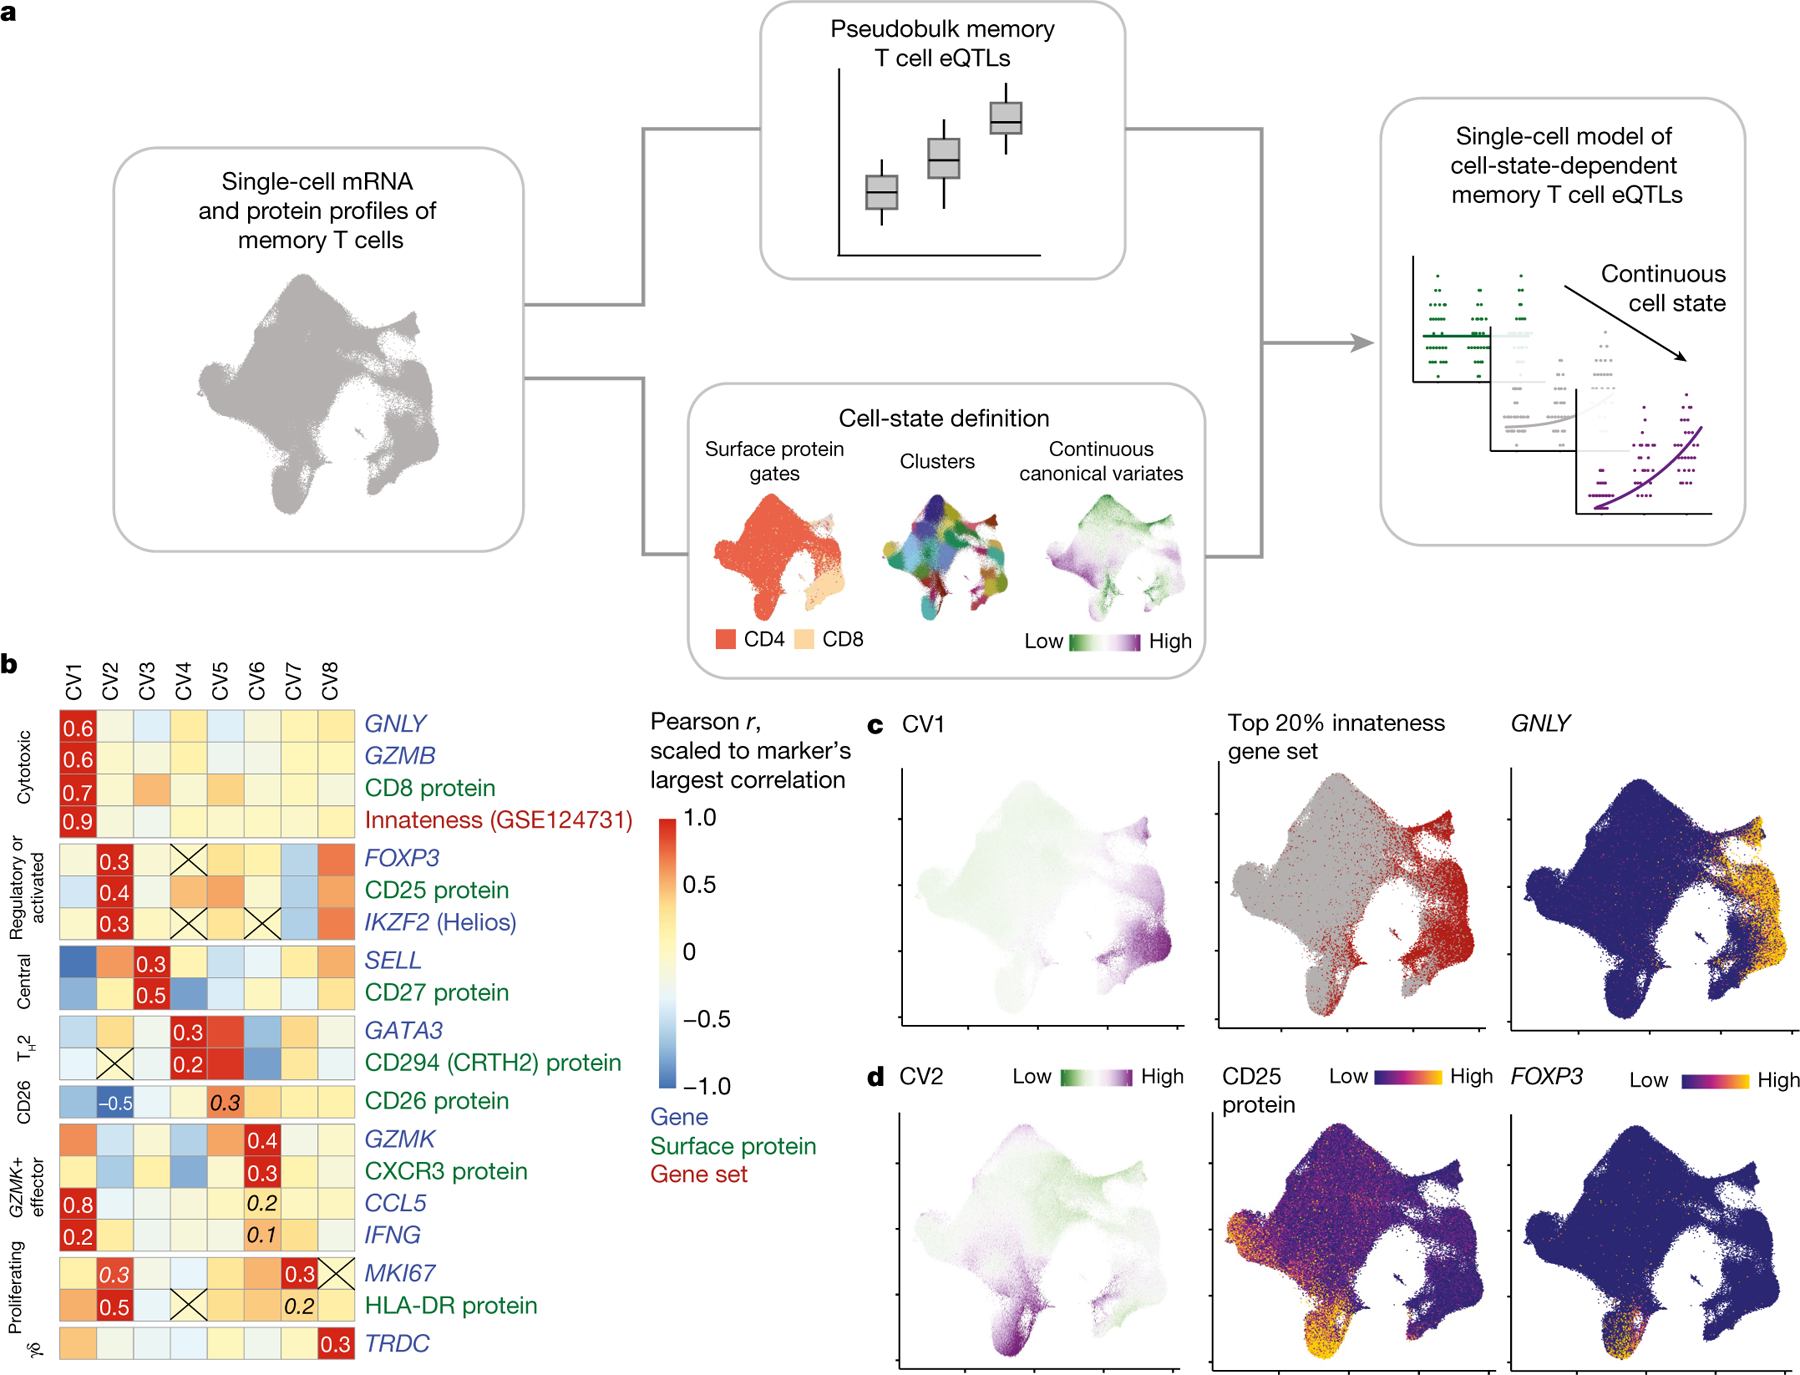
Fig. 1 |. Modelling memory T cell states and eQTLs.

a, Single-cell eQTL modelling strategy. We conduct a pseudobulk analysis of memory T cell eQTLs and define single-cell states with continuous canonical variates. These states can be used to identify dynamic memory T cell eQTLs in a single-cell model (shown here binned into low, medium and high for ease of visualization). b, Heat map coloured by scaled Pearson correlations between CVs and normalized expression of select marker genes or surface proteins and gene set scores (weighted sum of scaled gene expression). Correlations are scaled for each marker relative to the most extreme value, which is specified. Other correlations of interest are also written in italics and non-significant correlations are crossed out. c, Uniform manifold approximation and projection (UMAP) plots coloured by CV1 score (left), top 20% of cells based on innateness gene set score (red) (middle) and normalized GNLY expression (right). d, UMAP plots coloured by CV2 score (left), CD25 protein expression (middle) and normalized FOXP3 expression (right). Colours for CV scores range from low (green) to high (purple). Colours for expression range from minimum (blue) to maximum (yellow).
