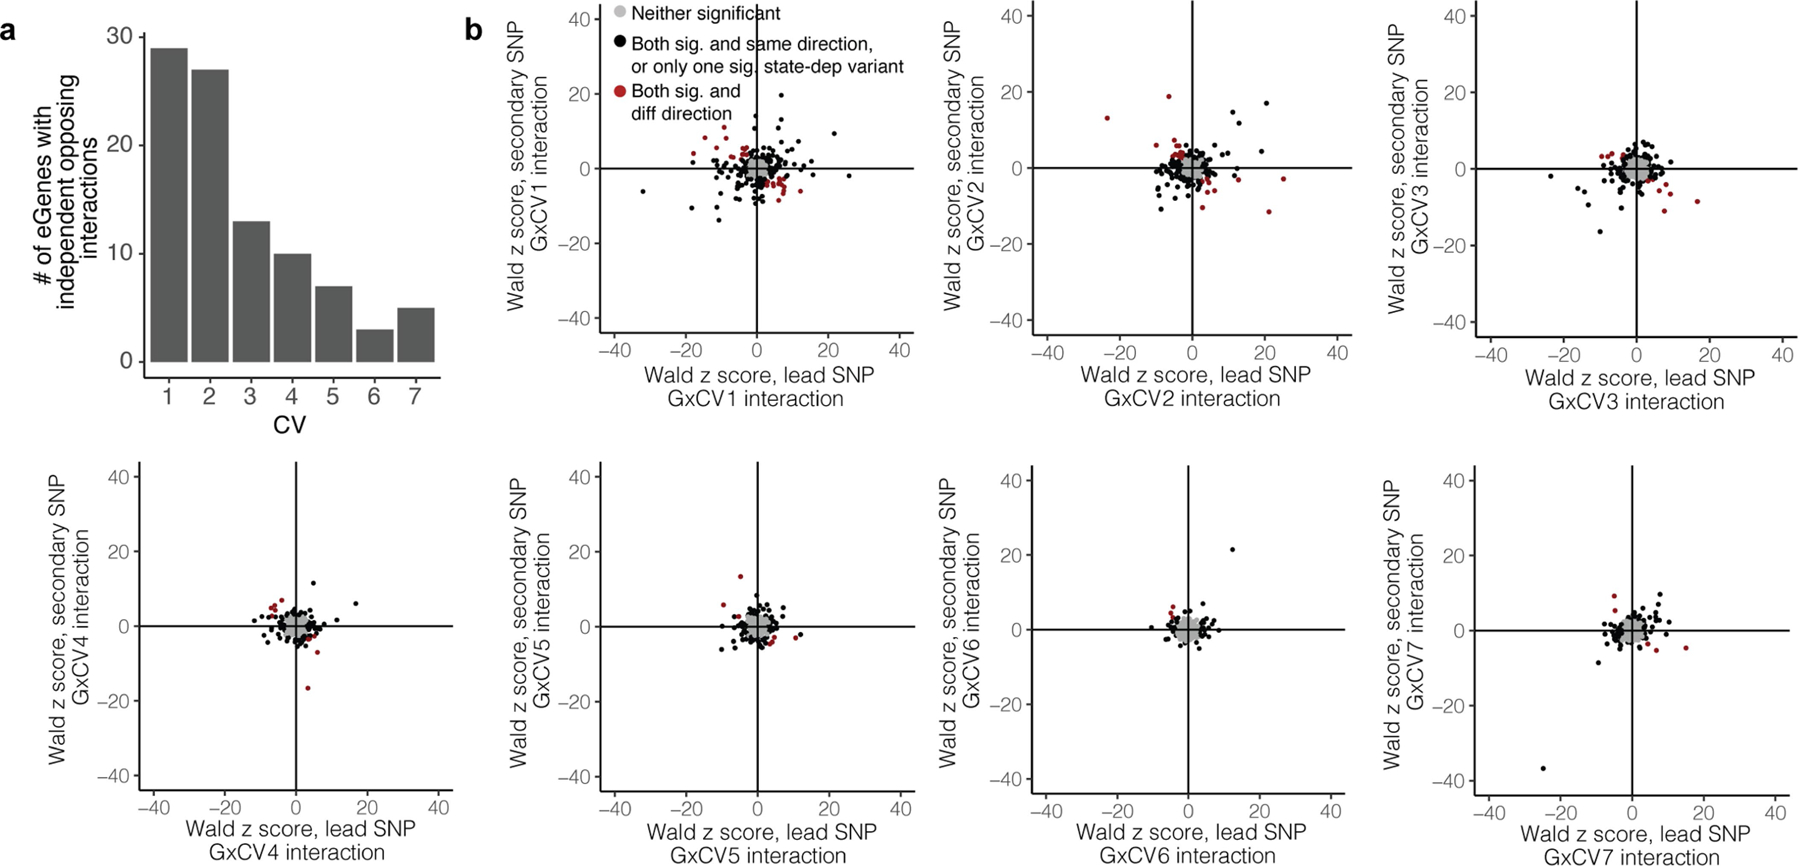
Extended Data Fig. 6 |. Opposite interaction directions for independent variants in a locus.

a, Bar plot of the number of eGenes for which the lead and secondary variants have opposite directions of interaction effect for each of the seven CVs. b, Comparison of interaction effect direction for lead and secondary variants for each of 436 eGenes with 2+ independent eQTLs. Each plot corresponds to one CV, from CV1 to CV7. Each point represents an eGene. For eGenes in grey, neither lead nor secondary variant was significantly dependent on the given CV state. For eGenes in black, either only one of the two eQTLs was significantly dependent on the CV, or both were significantly state-dependent with the same direction of effect. For eGenes in red, both lead and secondary variants were significantly state-dependent but with different directions of interaction with the given CV.
