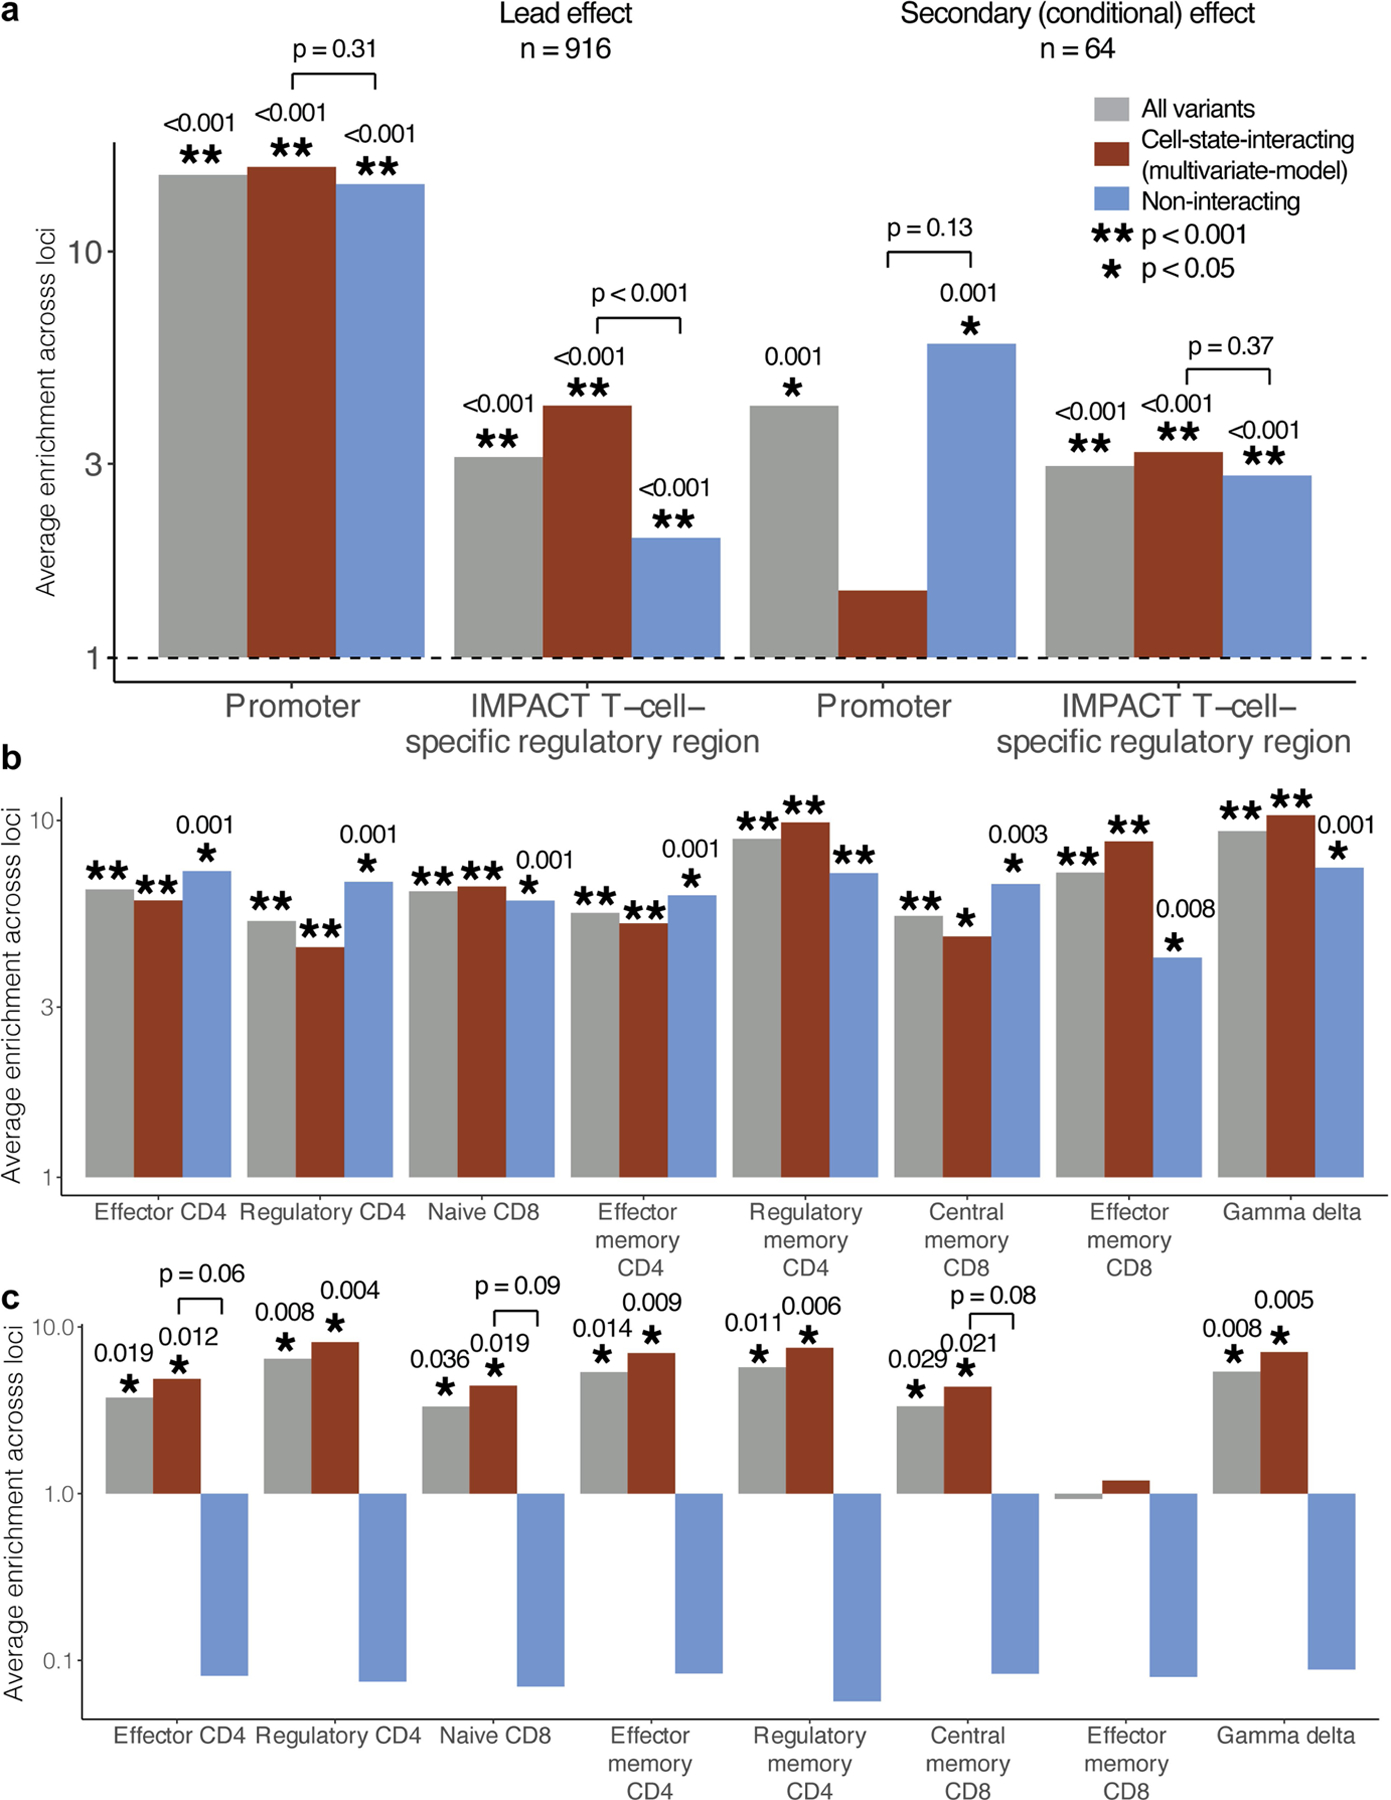
Extended Data Fig. 8 |. Additional regulatory region enrichment of eQTL effects.

a, We calculated the enrichment of lead effects or independent secondary (conditional) effects in promoter or T-cell-specific regulatory regions. Analysis was limited to loci that were also significant eGenes in Peruvian analysis and where at least one variant had PIP > = 0.5. b, We calculated the enrichment of lead effects and c, secondary effects in ATAC-seq peaks from Calderon, et al. 2019. Peaks were binarized as present or not in each sample at a threshold of > 5 CPM. In all plots, the height of the grey bar corresponds to the average enrichment calculated across all loci containing a variant with PIP < 0.05, red bar corresponds to the subset with significant cell-state interaction (LRT q < 0.05 in multivariate model with 7 CVs), and the blue bar corresponds to the subset without significant cell-state interaction. Bars with p > = 0.001 (limit of 1,000 permutations) are labelled with their one-sided p-value and with corresponding asterisks. Each pair of interacting/non-interacting bars is labelled with a one-sided permutation p value for the difference (interacting minus non-interacting; only labelled if p < 0.1 for the ATAC-seq analysis). The grey dotted line indicates enrichment statistic = 1.
