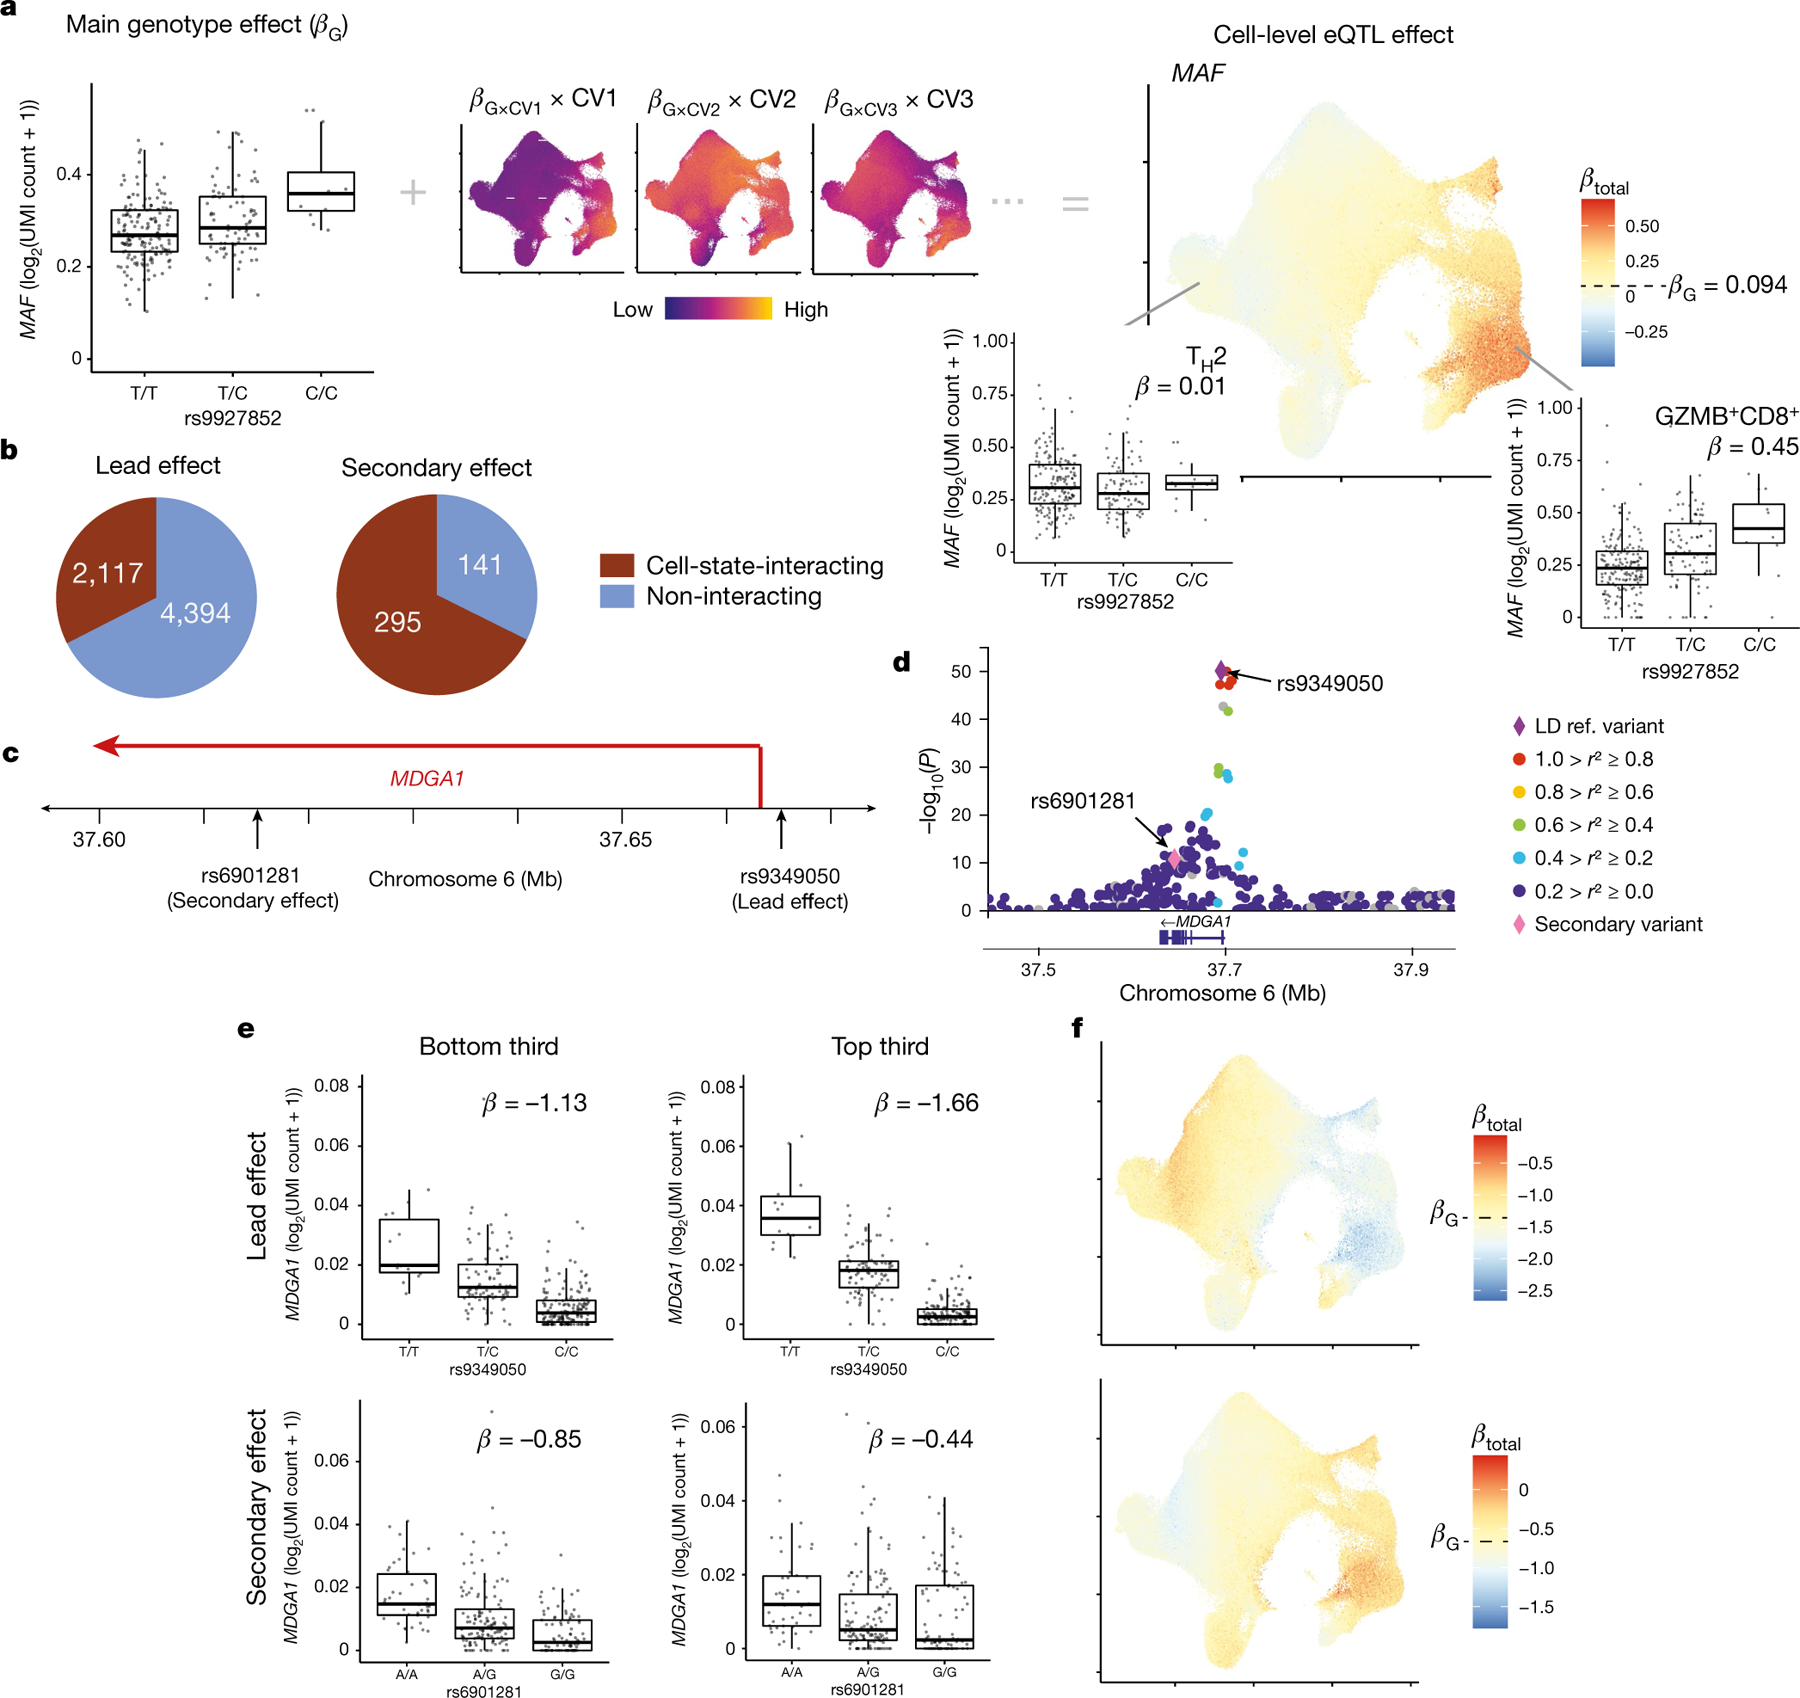
Fig. 3 |. Single-cell dissection of eQTLs.

a, Schematic of calculating cell-level eQTL β values with the example of MAF and rs9927852. UMAP (right) shows the total eQTL effect size at single-cell resolution, computed by summing the main genotype effect (box plot) and individual CV effects (UMAPs). CV UMAPs (middle) depict the interaction β value of each CV multiplied by cell-level CV scores scaled independently from lowest (purple) to highest (yellow). b, Number of lead eQTL variants and independent secondary variants with significant cell-state interactions (brown). c, MDGA1 locus with two independent eQTLs. d, Zoom plot of the MDGA1 locus. Purple diamond, lead variant; pink diamond, secondary variant; other variants are coloured according to r2 values with the lead variant in 1000 Genomes AMR (American ancestry: Puerto Rican in Puerto Rico, Colombian in Medellín, Peruvian in Lima, and Mexican ancestry in Los Angeles). e, Lead (top) and secondary (bottom) eQTLs for MDGA1 in cells with the bottom third (left) and top third (right) of CV1 scores. Each point represents the average log2(UMI count + 1) across all cells in the indicated CV1 score bin in a donor (n = 259), grouped by genotype. Box plots show median (horizontal bar), 25th and 75th percentiles (lower and upper bounds of the box, respectively) and 1.5 × IQR (or minimum and maximum values if they fall within that range; end of whiskers). β values are the average βtotal for cells in the bin. f, UMAP plots of the total eQTL effect of lead (top) and secondary (bottom) variants for MDGA1. Each cell is coloured by its scaled βtotal, centred on βG with the maximum (red) and minimum (blue) determined by the most extreme βtotal in any cell.
