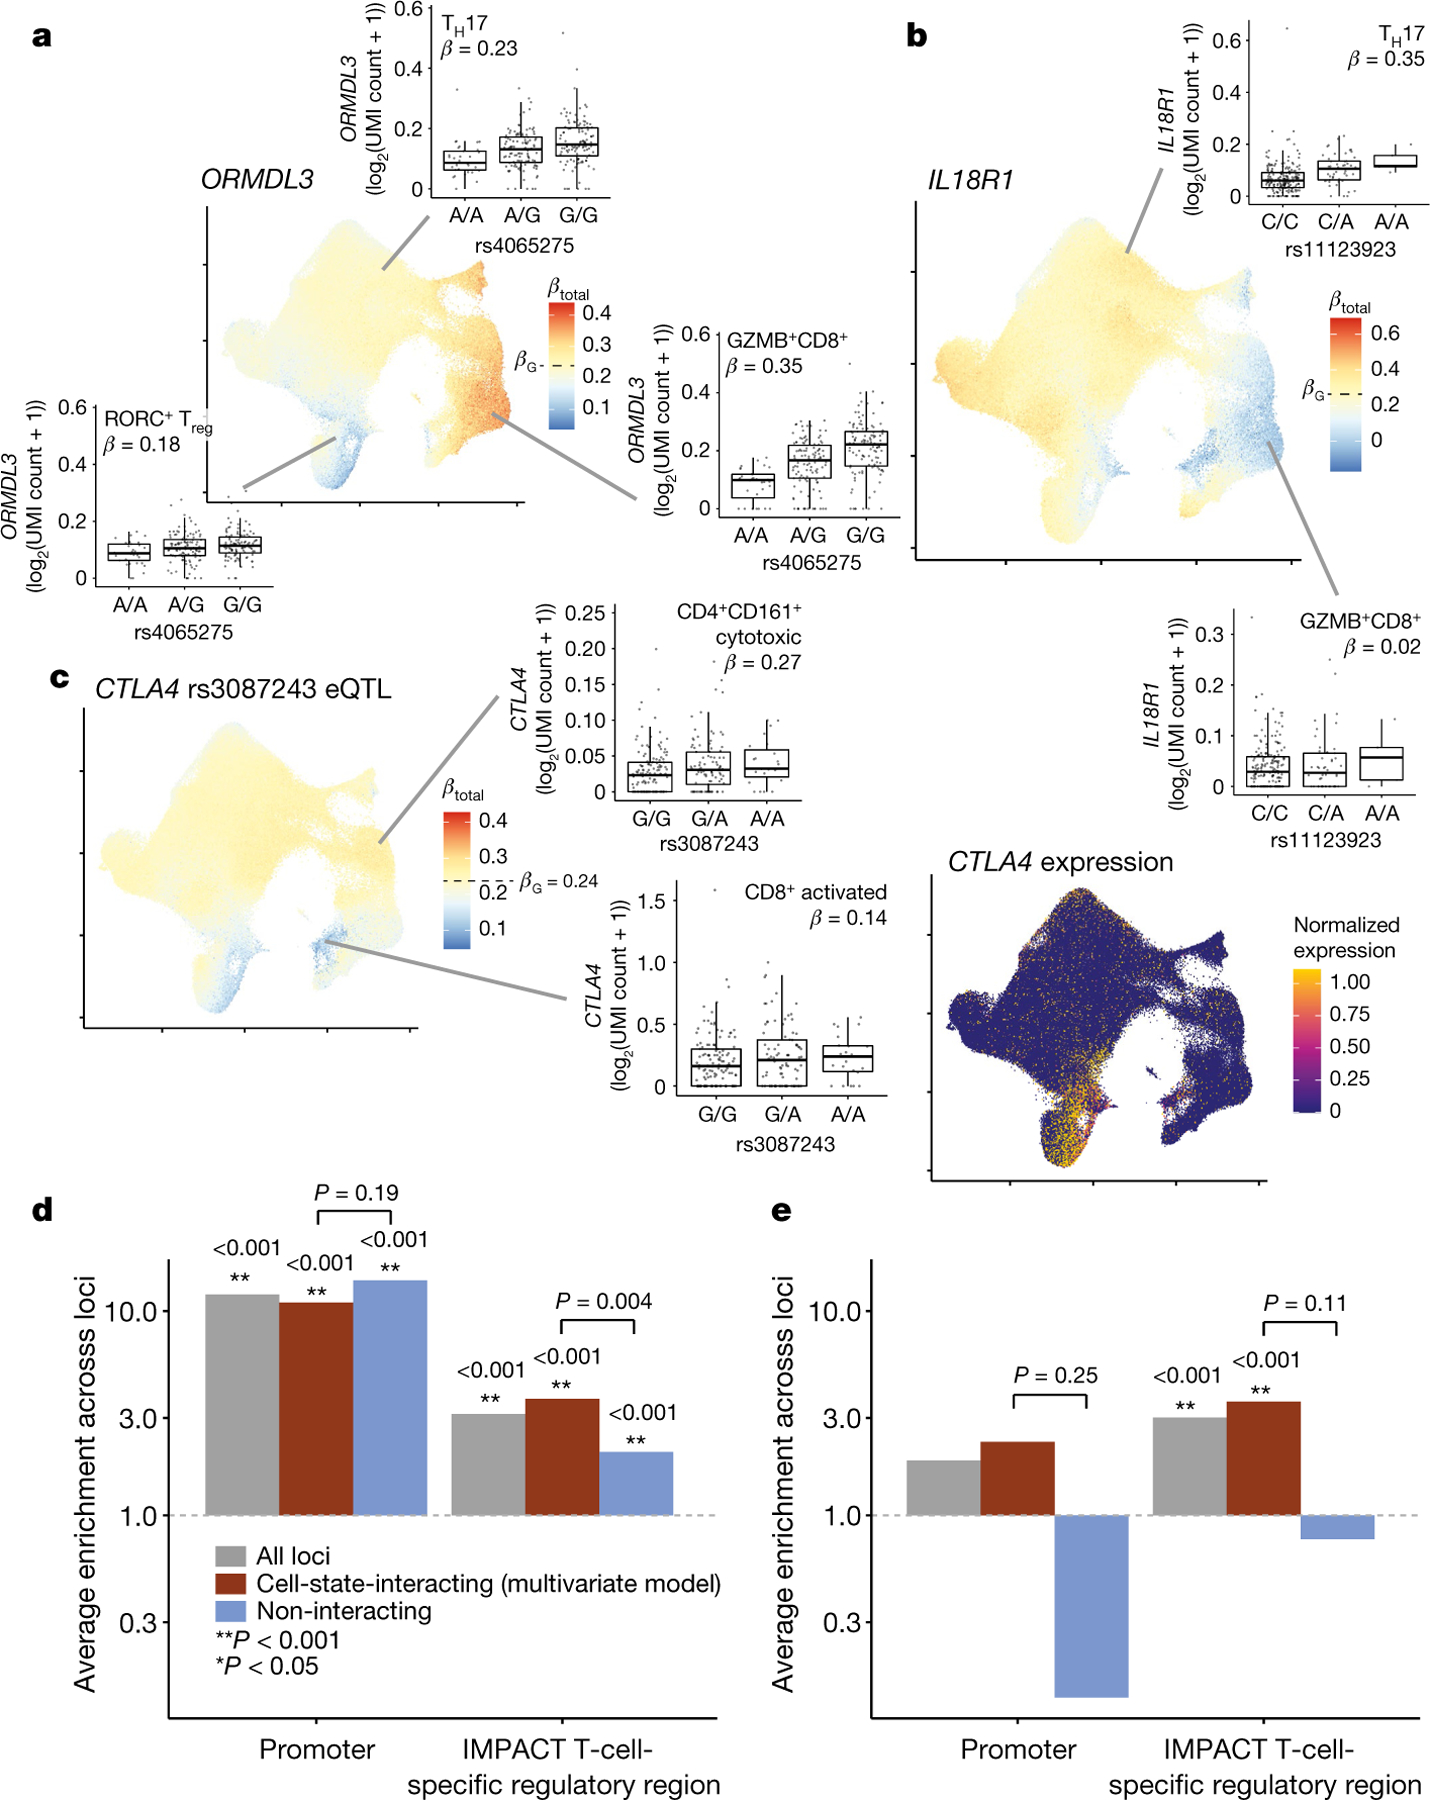
Fig. 4 |. Cell-state-dependent disease and regulatory effect of eQTLs.

a, b, UMAP plots of the single-cell effect sizes of the RA-linked rs4065275 eQTL for ORMDL3 (a) and the irritable bowel disease (IBD)-associated rs11123923 eQTL for IL18R1 (b). c, Left, UMAP plot of the single-cell effect size of the RA-associated rs3087243 eQTL for CTLA4. Right, single-cell normalized expression of the CTLA4 gene scaled from lowest (dark blue) to highest (yellow). For all single-cell eQTL effect UMAP plots, each cell is coloured by its scaled βtotal, centred on βG with the maximum (red) and minimum (blue) determined by the most extreme βtotal. For all box plots, each point represents the average log2(UMI count + 1) across all cells in the indicated cluster in a donor (n = 259), grouped by genotype. Box plots show median (horizontal bar), 25th and 75th percentiles (lower and upper bounds of the box, respectively) and 1.5 × IQR (or minimum and maximum values if they fall within that range; end of whiskers). β values are the average βtotal for all cells in the cluster. d, e, Enrichment of eQTL lead effects (d; n = 461) or independent secondary (conditional) effects (e; n = 53) in promoter or T-cell-specific regulatory regions. The analysis was limited to loci in which at least one variant had PIP ≥ 0.5. The grey bars show the average enrichment across all analysed loci; the red bars are limited to those with significant cell-state interaction (LRT q < 0.05 in multivariate model with 7 CVs); and the blue bars show those without significant cell-state interaction. Bars with P ≥ 0.001 (limit of 1,000 permutations) are labelled with their one-sided P value and with corresponding asterisks. Pairs of interacting and non-interacting bars are labelled with a one-sided permutation P value for the difference (interacting minus non-interacting). The grey dotted line indicates enrichment statistic = 1.
