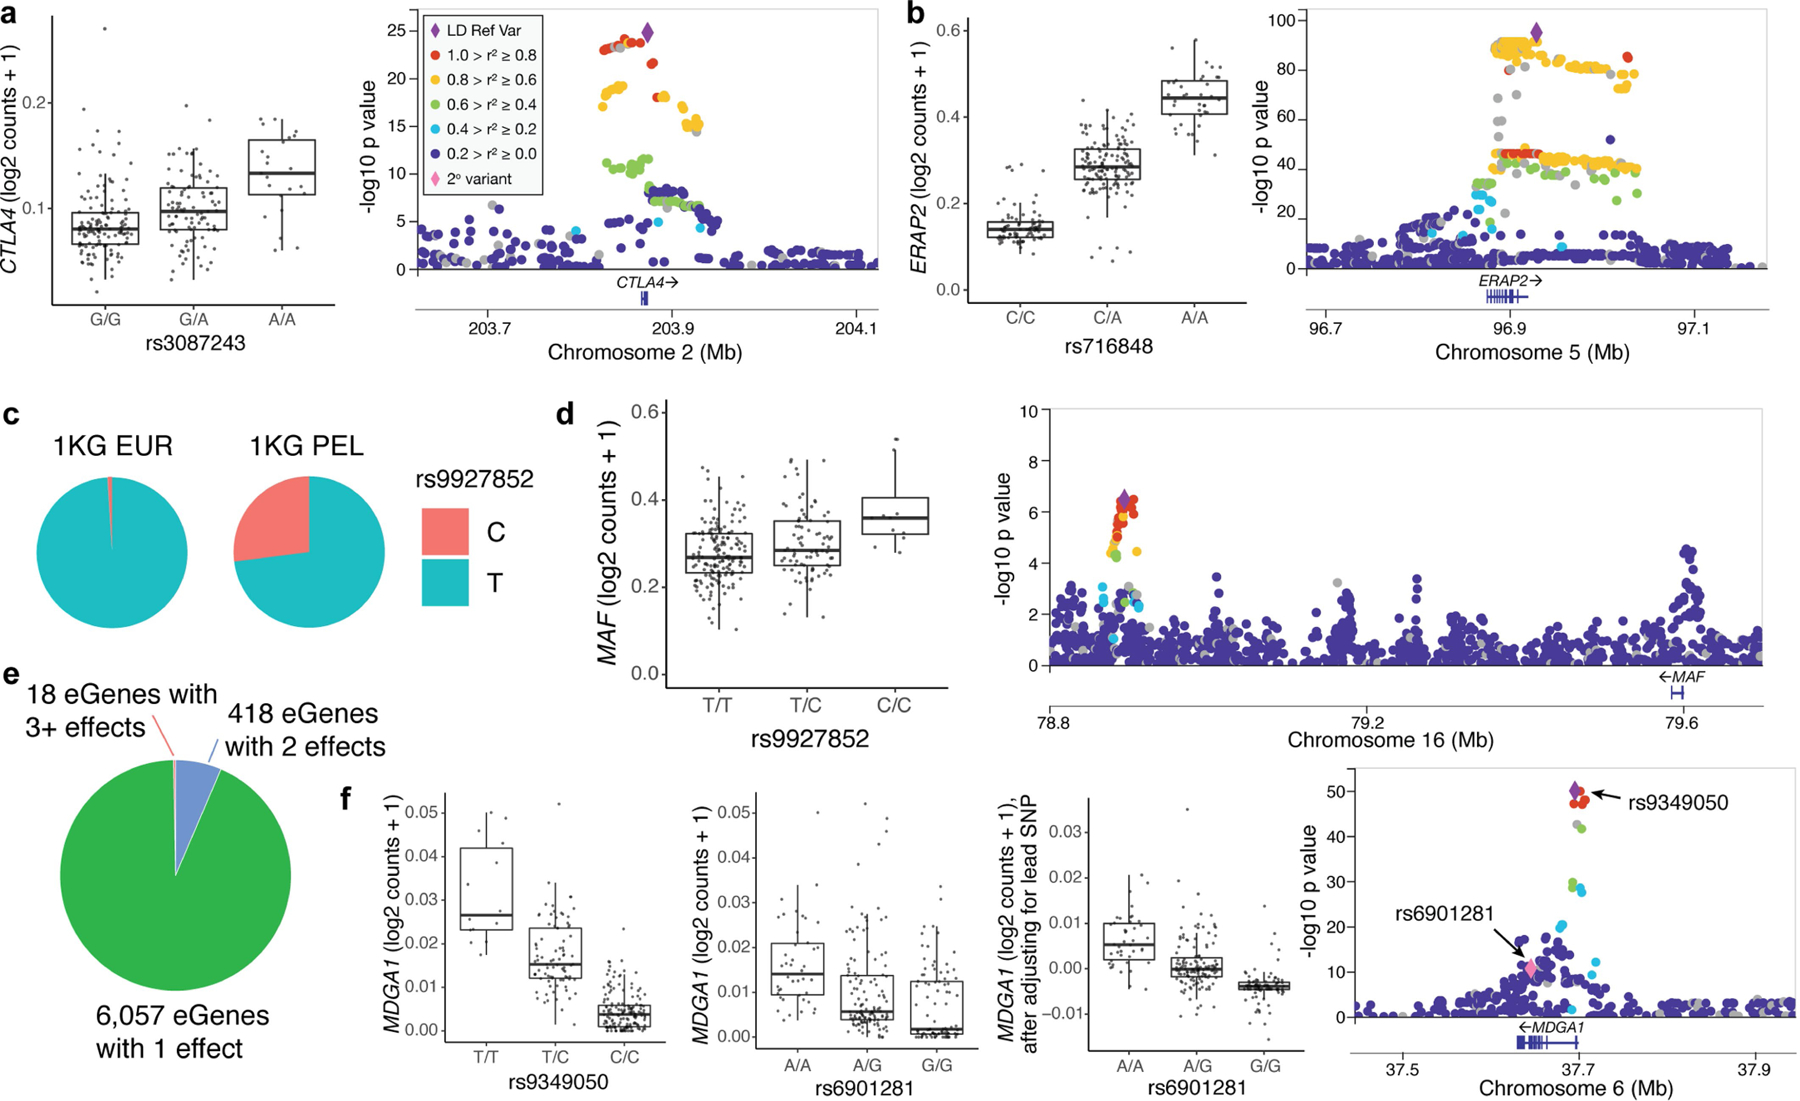
Extended Data Fig. 1 |. Memory T cell eQTLs.

a, (left) Box plot and (right) locus plot of rs3087243 eQTL for CTLA4 and b, rs716848 eQTL for ERAP2. Except where indicated, each point in box plots (panels a, b, d, f) represents the average log2(UMI counts + 1) across all cells in a donor (n = 259), grouped by genotype. Box plots show median (horizontal bar), 25th and 75th percentiles (lower and upper bounds of the box, respectively) and 1.5 times the IQR (or minimum/maximum values if they fall within that range; end of whiskers). Each locus plot shows the variants in a +/250kb window around the TSS plotted based on their nominal pseudobulk eQTL p value and genomic coordinate. The purple diamond is the lead variant and other variants are coloured based on their r2 with the lead variant in 1000 Genomes AMR (American ancestry, including Puerto Rican in Puerto Rico, Colombian in Medellín, Peruvian in Lima, and Mexican ancestry in Los Angeles). c, Pie charts of the allele frequencies at rs9927852 in 1000 Genomes EUR (European) and PEL populations. d, Box plot and locus plot of rs9927852 eQTL for MAF (n = 259). e, Number of eGenes with 1, 2, or 3+ independent eQTLs. f, Box plots for lead (rs9349050, left) secondary (rs6901281, middle), and secondary conditioned on lead (right) eQTL variants for MDGA1. In the box plot for rs6901281 conditioned on rs9349050, each point represents the average residual of log2(UMI counts + 1) after regressing out genotype at rs9349050 across all cells in a donor (n = 259). In the locus plot, the pink diamond is the secondary variant.
