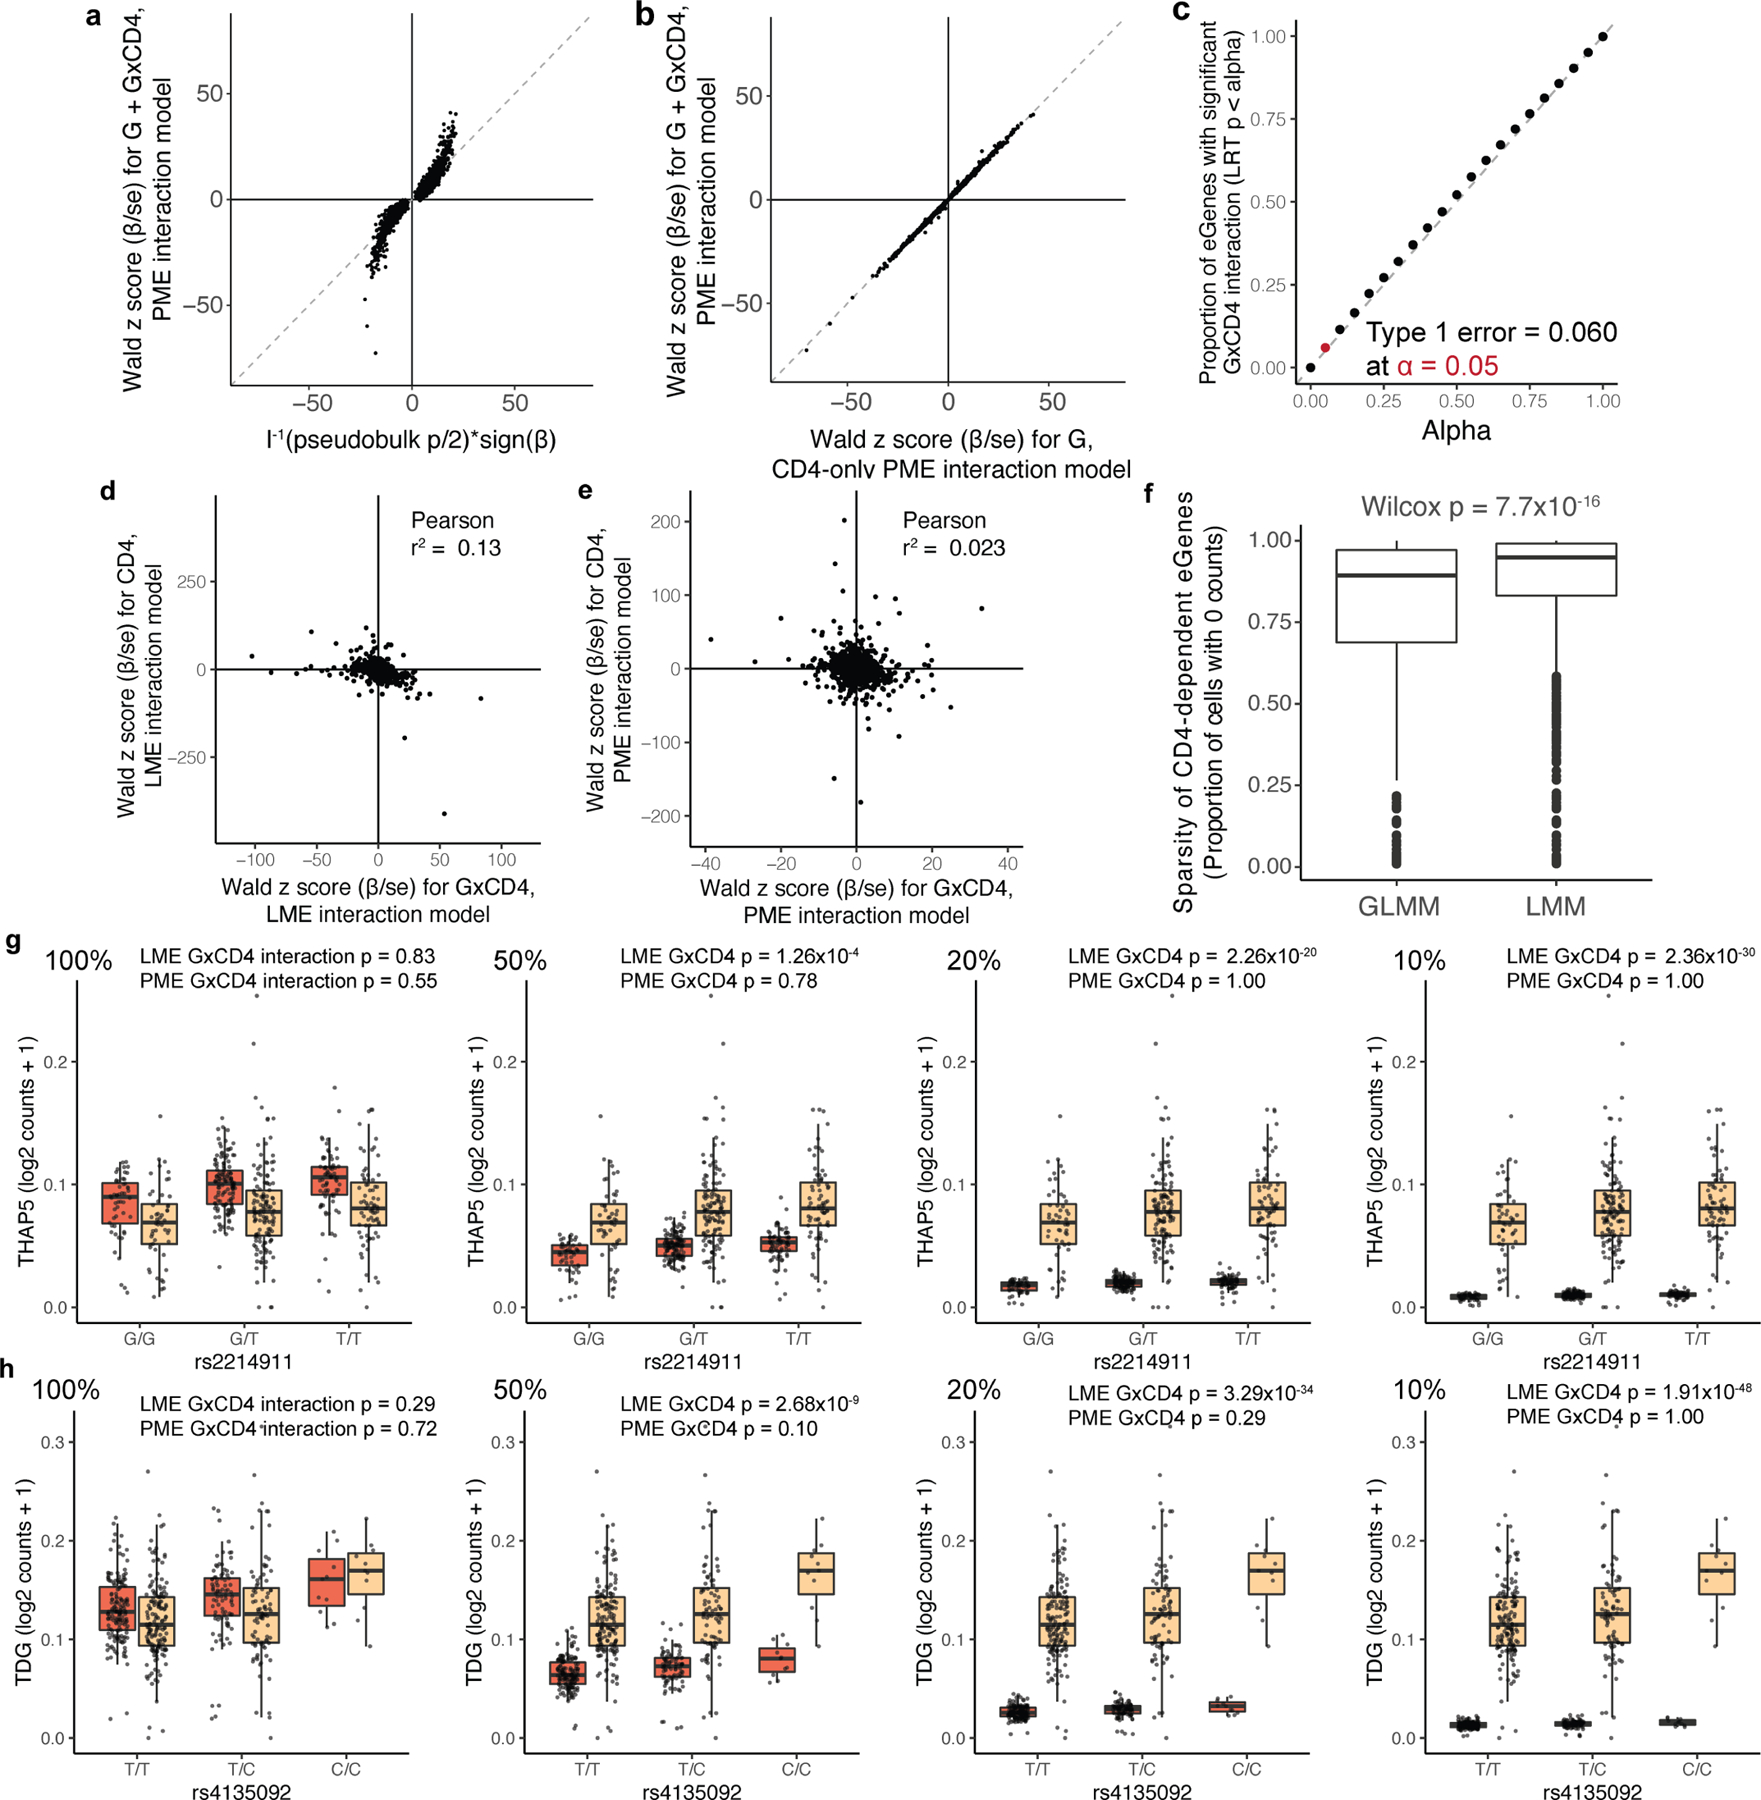
Extended Data Fig. 3 |. Assessing the robustness of the single-cell Poisson model.

a, b, Dot plot of each memory-T-cell eGene based on Wald z score for total β (βG+βG×CD4) in PME interaction model of all cells and LRT-based statistic from a, pseudobulk model or b, Wald z score for βG from a PME model of only CD4+ cells. c, Proportion of eGenes with significant βG×CD4 under genotype permutation. Each dot represents the proportion significant at the given alpha threshold. d, e, Dot plot of memory-T-cell eGenes (n = 6,511) based on z score for cell state β (βCD4 or βCD8) and z score for cell state interaction β (βG×CD4 or βG×CD8) in d, LME and e, PME models. f, Box plot of sparsity of eGenes with significant CD4 interactions (q < 0.05) in GLMM or LMM. P value is from a two-sided Wilcoxon rank-sum test (nGLMM = 612 genes, nLMM = 1214 genes). Each point represents a gene and box plots show median (horizontal bar), 25th and 75th percentiles (lower and upper bounds of the box, respectively) and 1.5 times the IQR (or minimum/maximum values if they fall within that range; end of whiskers). g, rs2214911 eQTL for THAP5 and h, rs4135092 eQTL for TDG in CD4+ (orange) and CD8+ (beige) cells. Box plots show the eQTL effects as per-cell gene expression decreased from 100% to 50, 20, and 10 percent in CD4+ cells (left to right). Each point represents the average log2(UMI counts + 1) across all cells in the indicated subset of cells in a donor (n = 259), grouped by genotype. Box plots show median (horizontal bar), 25th and 75th percentiles (lower and upper bounds of the box, respectively) and 1.5 times the IQR (or minimum/maximum values if they fall within that range; end of whiskers).
