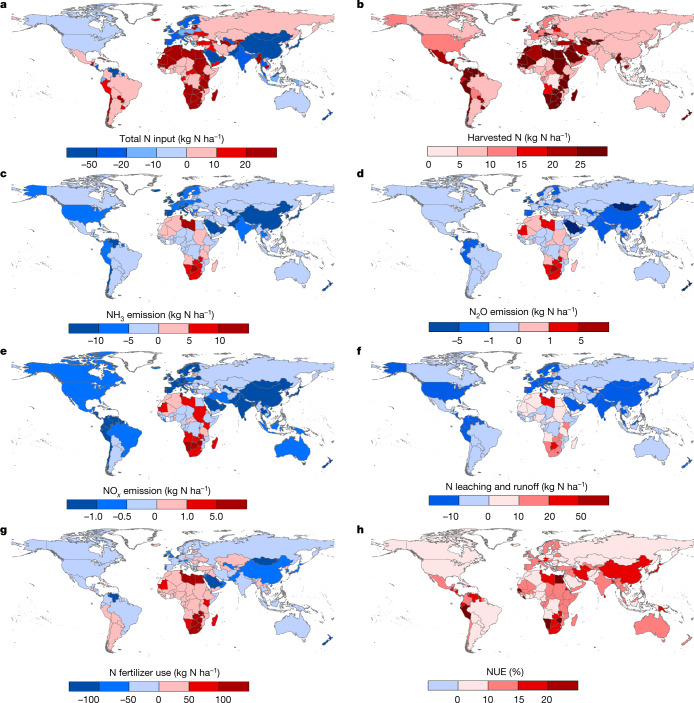
Fig. 2. Changes in global N budget in croplands with the best adoption of the 11 selected measures.
a, Total N input. b, Harvested N. c, NH3 emission. d, N2O emission. e, NOx emission. f, N leaching and runoff. g, N fertilizer use. h, NUE. The base year is 2015 and the changes are calculated on the basis of the differences between the N fluxes in 2015 before and after the implementation of the most appropriate set of measures at the national level. The changes in NUE are in percentage points; for instance, the NUE increased by 17 percentage points in China. The base map is applied without endorsement from GADM data (https://gadm.org/).

