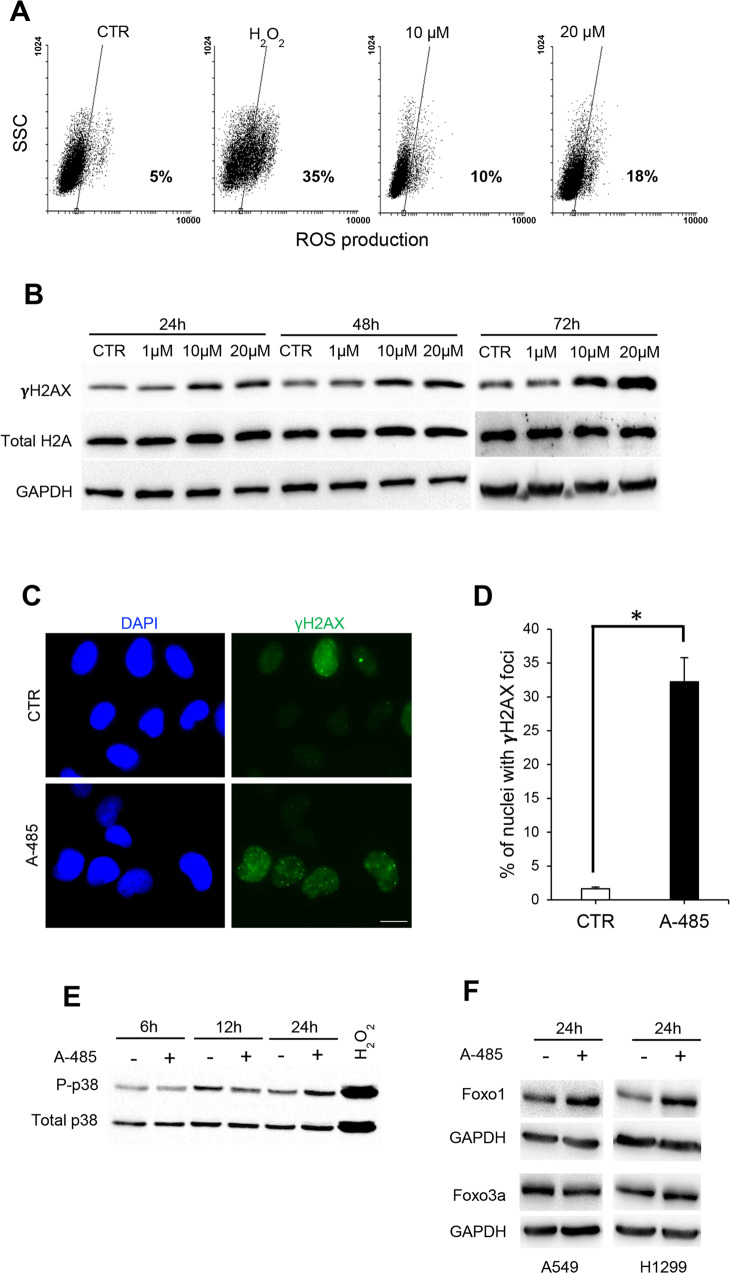
Fig. 6. Induction of ROS contributes to A-485-mediated senescence.
A Representative flow cytometric analysis of ROS levels by H2DCFDA assay in A549 cells untreated or treated with A-485 for 72 h. H2O2 was used as a positive control. The percentage of cells positive for H2DCFDA staining is shown. B Western blot of γH2AX and total H2A in A549 cells untreated or treated with different concentrations of A-485 for 24, 48, or 72 h. C Representative images of γH2AX nuclear foci by fluorescence microscopy in A549 untreated or treated with A-485 for 72 h, and D quantification of the percentage of cells showing γH2AX nuclear foci. The results were statistically evaluated using t-test, *p < 0.05. E Western Blot analyses of a phosphorylated and total form of p38 in A549 cells treated with A-485 (20 μM) for the indicated times. H2O2 was used as a positive control. F Western blot of Foxo1 and Foxo3a expression in A549 and H1299 cells, untreated or treated with A-485 (20 μM) for 24 h. GAPDH is shown as a loading control. Western blots representative of three independent experiments with similar results are shown. CTR represents 0.1% DMSO treated cells.

