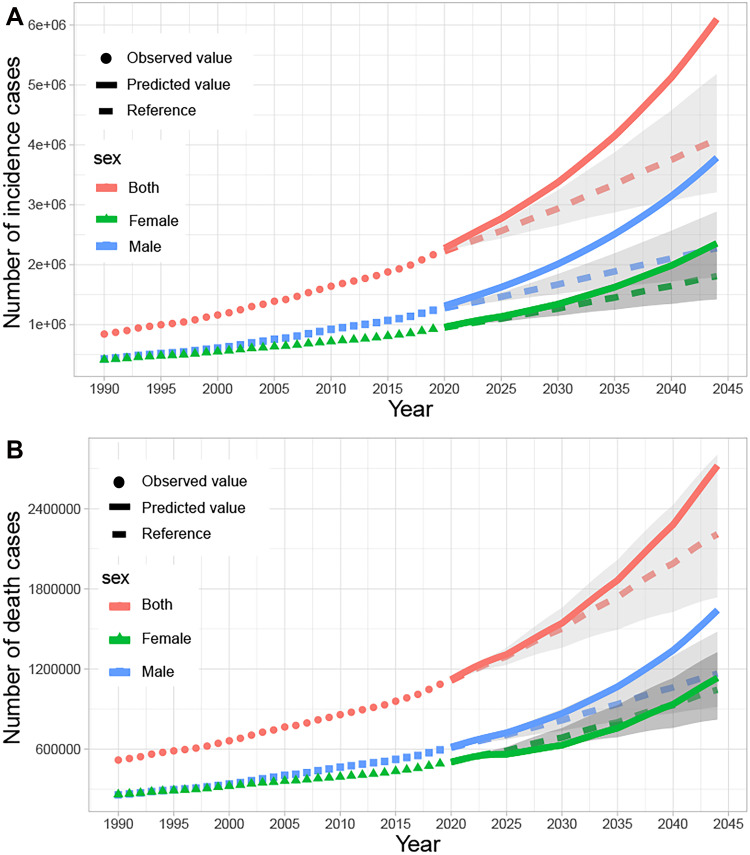
Figure 5.
The observed (dashed line) and predicted (solid line) cases (A) and deaths (B) of colorectal cancer from 1990 to 2044. The upper bound of Shading represents the rate increased by 1% per year (pessimistic reference) and the lower bound represents decreased by 1% per year (optimistic reference) based on the rate observed in 2019.

