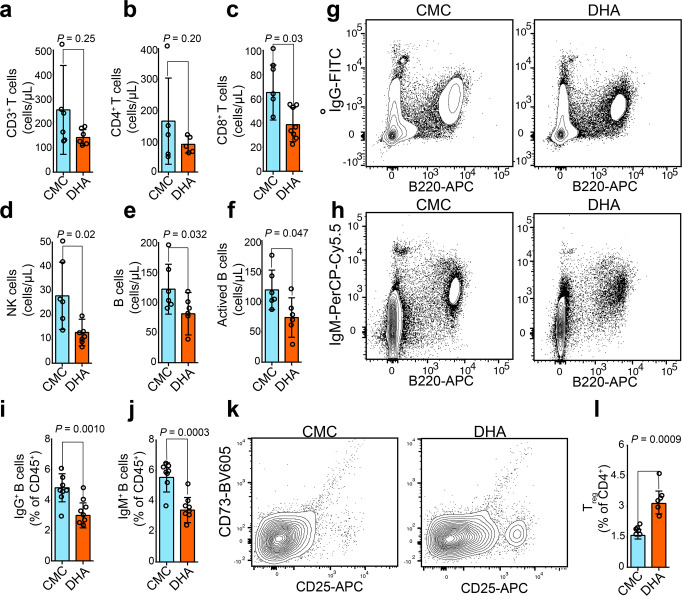
Fig. 1. Dihydroartemisinin (DHA) suppressed plasma cells but promoted Treg cell proliferation.
a–f Bar graphs represent decreased numbers of CD3+ T cells, CD4+ T cells, CD8+ T cells, NK cells, B cells, and activated B cells from DHA- and CMC-treated mouse groups (n = 5). g, h Representative images of B220+ IgG+ plasma cells and B220+ IgM+ plasma cells analyzed by cytometry. i, j Bar graphs represent significant decrease in percentages of B220+ IgG+ plasma cells and B220+ IgM+ plasma cells in DHA-treated group compared to CMC-treated group on day 26 post treatment (n = 8). k Representative flow cytometry images of Treg cells from DHA- and CMC-treated mouse groups. l A bar graph represents significant increases in percentages of Treg cells in DHA-treated mice versus CMC control group (n = 6). DHA = dihydroartemisinin group; CMC = carboxymethyl cellulose solvent solution control. The error bars indicate standard error. Statistical significance was determined with Mann–Whitney test.

