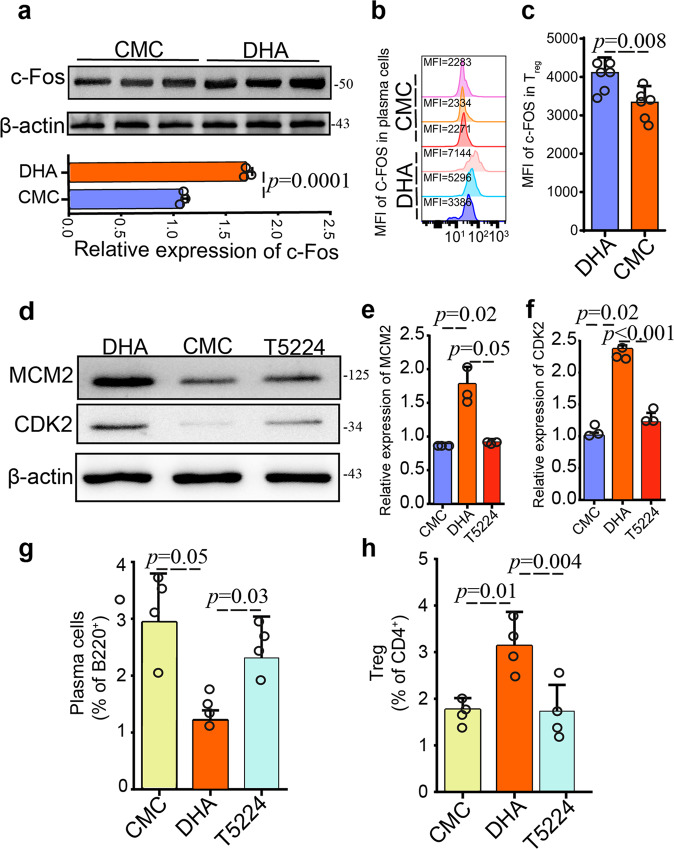
Fig. 6. Dihydroartemisinin (DHA) induced c-Fos expression in both Treg and PC B cells.
a The expression variations of c-Fos in peripheral blood were determined by Western blot, with β-actin serving as a loading control. Bar graph shows differences in normalized abundance of the c-Fos between CMC control and DHA-treated groups (n = 3, Student t-test). b, c Quantification of the MFI of the c-Fos transcription factors in plasma cells and Tregs from CMC and DHA treated mice. Δ MFI (Mean Fluorescence Intensity) = MFI antibody – MFI isotype control. DHA-treated mice express more c-Fos than CMC-treated mice in Tregs and plasma cells (n = 6, Student t-test). d Western blot analysis of CDK2 and MCM2 proteins in peripheral blood Treg from mouse blood treated with DHA alone, DHA with the T5224 inhibitor, and CMC control was performed with protein specific antibodies. e, f Bar graph shows differences in normalized abundance of the CDK2 and MCM2 between CMC control, DHA treatment, and DHA plus T5224 groups (n = 3, Student t-test). Increased CDK2 and MCM2 expression were observed in Treg treated with DHA compared to that of CMC-treated mice, whereas CDK2 and MCM2 expression were greatly reduced in mice treated with T5224 in the presence of DHA. g, h Bar graph shows differences in percentage of circulating plasma cells (B220-gated) and peripheral blood Treg (CD4-gated) in the CMC alone, DHA and DHA plus T5224 treated groups (n = 4, Student t-test). The error bars indicate standard error.

