
Fig. 1. Quality factors for all out-of-plane modes up to 1.8 MHz of design A plotted over the eigenfrequencies of the modes at 1 mbar and 25 ∘C.
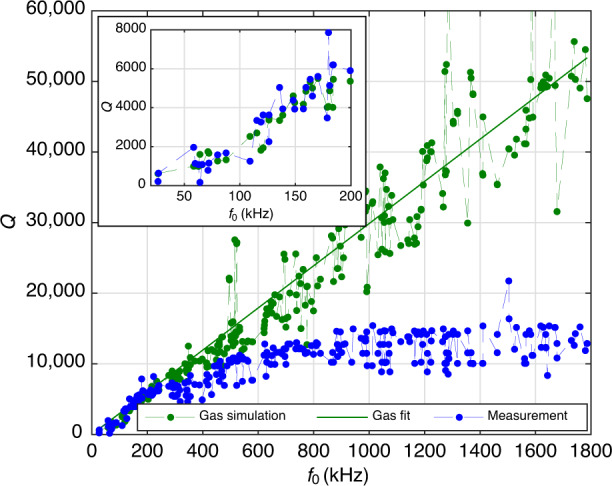
The green dots show the simulated quality factors based on gas damping. The solid green line is a linear fit of the simulated quality factors over frequency and indicates the trend of the gas damping quality factors. The blue dots show the measured quality factors. The inset shows a magnified plot up to 200 kHz.