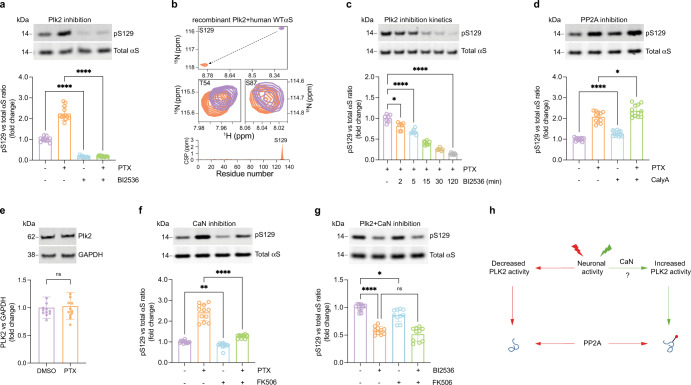
Fig. 3. Activity-dependent pS129 is regulated by Plk2, PP2A, and calcineurin.
a DIV17-21 rat cortical neurons treated with 20 µM PTX, 500 nM BI2536 (Plk2 inhibitor) or PTX + BI2536 for 2 h. WB for total αS and pS129. N = 3 independent experiments on different days, n = 12 biological replicates total. *p < 0.1; ****p < 0.0001. Mean +/− SD. Brown-Forsythe and Welch ANOVA with Dunnett’s T3 post hoc test for multiple comparisons. b 2D 1H-15N HSQC NMR spectrum of recombinant, N-terminally acetylated human αS in the presence (orange) or absence (purple) of recombinant Plk2 (see “Methods” for details and Supplementary Fig. 4). Spectrum in the presence (purple) or absence of Plk2 (orange) is shown for S129 (top), T54, and S87 (middle); residue-resolved combined chemical shift perturbations (CSPs) of backbone amide resonances (bottom). c DIV17-21 rat cortical neurons treated with 20 µM PTX for 2 h and 500 nM BI2536 co-administered for 0, 2, 5, 15, 30, or 120 min. WB for total αS and pS129. N = 2 independent experiments on different days, n = 7 biological replicates total. *p < 0.1; ****p < 0.0001. Mean +/− SD. Brown-Forsythe and Welch ANOVA with Dunnett’s T3 post hoc test for multiple comparisons. d 1.5 nM PP2A inhibitor calyculin A (Caly A) treatment for 2 h. WB for total αS and pS129. N = 3 independent experiments on different days, n = 12 biological replicates total. ***p < 0.1; ****p < 0.0001. Mean +/− SD. Brown-Forsythe and Welch ANOVA with Dunnett’s T3 post hoc test for multiple comparisons. e DIV17-21 rat cortical neurons treated with 20 µM PTX or DMSO control for 2 h. WB for PLK2 and GAPDH (loading control). N = 3 independent experiments on different days, n = 12 biological replicates. ns not significant. Mean +/− SD. Unpaired t-test, Welch’s correction; two-tailed. f DIV17-21 rat cortical neurons treated with DMSO, 20 µM PTX, 2 µM CaN inhibitor FK506, or both for 2 h. WBs to total αS and pS129. N = 3 independent experiments on different days, n = 12 biological replicates total. **p < 0.01; ****p < 0.0001. Mean +/− SD. Brown-Forsythe and Welch ANOVA with Dunnett’s T3 post hoc test for multiple comparisons. g DIV18 rat cortical neurons treated with 50 nM Plk2 inhibitor BI2536, 2 µM CaN inhibitor FK506, or both for 2 h. WB for total αS and pS129. N = 3 independent experiments on different days, n = 10 biological replicates total. ns not significant; **p < 0.01; ****p < 0.0001. Mean +/− SD. Brown-Forsythe and Welch ANOVA with Dunnett’s T3 post hoc test for multiple comparisons. h Schematic: the molecular cascade leading to activity-dependent pS129 (see main text for details).

