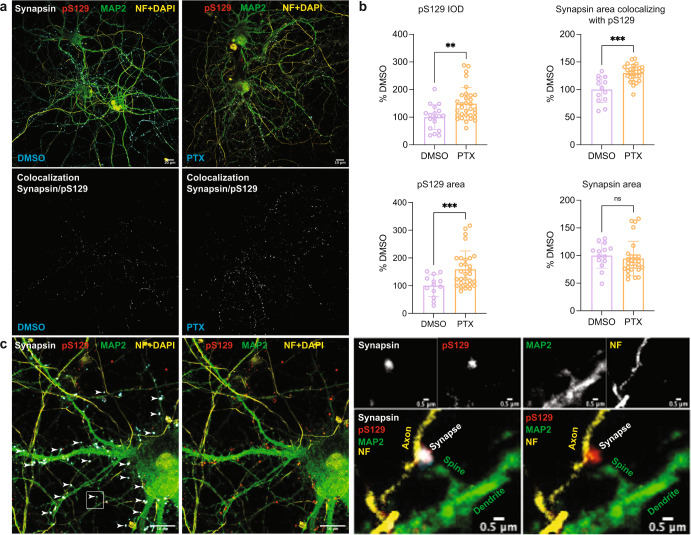
Fig. 5. Increased pS129 signal and localization in synapsin-containing boutons after PTX stimulation.
a Representative images of synapsin/pS129 colocalization in DIV18 rat cortical neurons treated with DMSO vs. 20 µM PTX. Top images: synapsin, pS129, MAP2, and neurofilament (NF) + DAPI staining. DMSO control on the left, PTX treatment on the right. Bottom images: colocalization mask synapsin/pS129. DMSO control on the left, PTX treatment on the right. Scale bar, 10 μm. b Quantifications (DMSO vs. PTX). Top left, pS129 integrated optical density (IOD). Quantification of N = 14 images for DMSO; N = 30 images for PTX. Top right, synapsin area colocalizing with pS129. N = 13 images for DMSO; N = 29 images for PTX. Bottom left, pS129 area. N = 13 images for DMSO; N = 30 images for PTX. Bottom right, synapsin area. N = 14 images for DMSO; N = 30 images for PTX. Each image contained ~3–5 cells. **p < 0.01; ***p < 0.001; ns not significant. Mean ± SD. Unpaired t-tests with Welch’s correction; two-tailed. c Localization of pS129 at synapsin-immunopositive synapses in PTX-stimulated neurons. Arrowheads indicate synapses labeled for both pS129 and synapsin. All visualized images represent maximized 3D projection of 0.9 µm thick z-stacks. Scale bars in the left images, 10 µm; scale bars in the right images, 0.5 µm. Magnifications on the right: specific colocalization of pS129 with synapsin at presynaptic terminals in contrast to MAP2 positive dendritic profiles.

