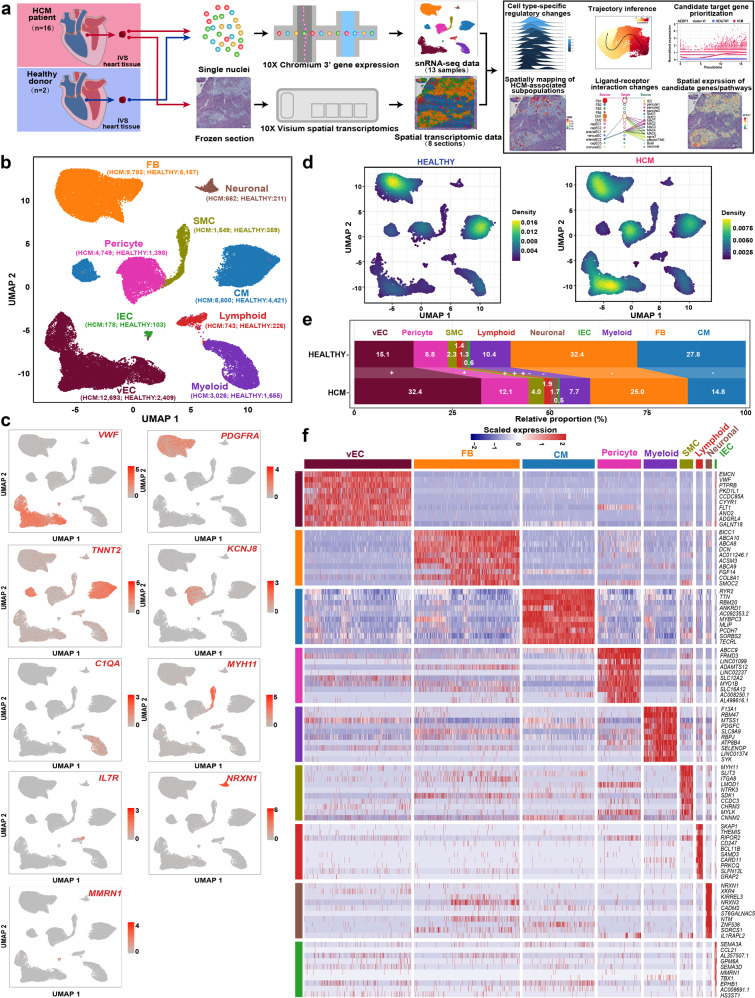
Fig. 1. The changes in relative proportion for each cell type of human cardiac tissues in HCM.
a Schematic representation of the overall experimental procedure. The cardiac IVS tissues of HCM patients who underwent surgical myectomy were collected for snRNA-seq (n = 10; 10 samples) and spatial transcriptomic assays (n = 6; 8 tissue sections). As a control, cardiac IVS tissues from healthy heart transplant donors (n = 2; 3 samples; the samples HEALTHY1A and HEALTHY1B were from the same donor) were subjected to snRNA-seq. b Unbiased clustering of 55,122 nuclei from all 13 samples identifies 9 major cell types. The nucleus count is indicated by the number in parenthesis. c UMAP plot showing the expression of the established marker genes for each cell type. d Comparison of the nucleus densities in the UMAP space between the two conditions reveals remarkable changes in the relative proportion of cell types in HCM. Nuclei were randomly sampled in equal numbers for each group (n = 15,939). e Relative proportion of each cell type in each condition. +: expansion; –: contraction. f Heatmap showing the molecular signature of each lineage. CM cardiomyocyte, FB fibroblast, lEC lymphatic endothelial cell, SMC smooth muscle cell, vEC vascular endothelial cell.

