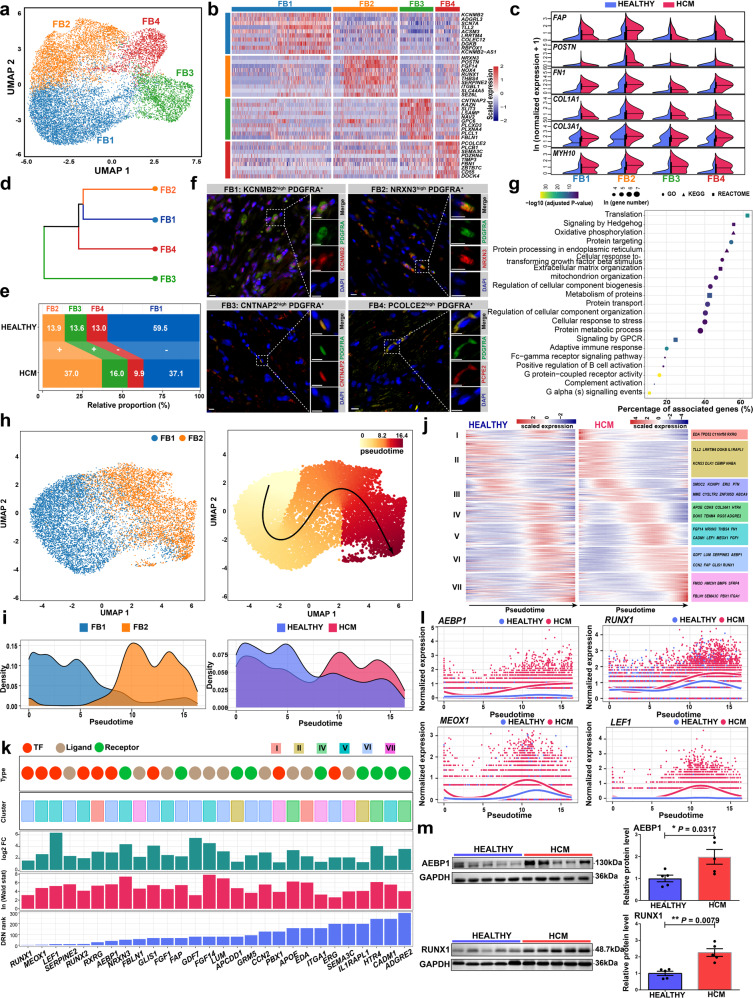
Fig. 3. Fibroblast-specific regulatory changes in the pathological remodeling of HCM.
a UMAP plot showing the fibroblast subpopulations. b Heatmap showing the molecular signature of each subpopulation. c Split violin plots showing the expression of the markers for activated fibroblasts. d Hierarchical clustering of the subpopulations. e Relative proportion of each subpopulation in the fibroblasts from each condition. +: expansion; –: contraction. f Immunofluorescence staining confirmed the presence of the four subpopulations in cardiac tissues from HCM patients. Fibroblasts are marked by PDGFRA. Scale bar: 10 μm. g Representative terms enriched in the upregulated genes in fibroblasts from HCM patients than those from healthy donors. Adjusted P-value < 0.05, hypergeometric test. h UMAP plot showing the subpopulations FB1 and FB2 (left panel), and the cellular trajectory reconstructed for fibroblast activation using Slingshot (right panel). The arrow shows the direction of cellular state changes. i Density curves showing the distributions of the two fibroblast subpopulations (left panel) and the fibroblasts from different conditions along the trajectory (right panel). **P-value < 2.2e-16, Kolmogorov-Smirnov test. j Heatmaps showing the expression dynamics of the 432 genes with significantly different patterns along the trajectory between the two conditions. These genes were detected by differential expression pattern analysis using the “conditionTest” function of tradeSeq and were categorized into 7 gene clusters by hierarchical clustering. The significance threshold was set to an adjusted P-value < 0.05. k The potential key genes that were prioritized based on the results of three independent analyses including the difference in expression patterns, the fold change of expression levels, and the centrality change in GRNs. l Smoothed expression curves of representative candidate genes along the trajectory in both conditions. m Western blot assays confirmed that the protein levels of AEBP1 and RUNX1 were significantly changed in cardiac tissues from HCM patients (n = 5) compared with those from healthy donors (n = 5). *P < 0.05, **P < 0.01, Wilcoxon rank-sum test.

