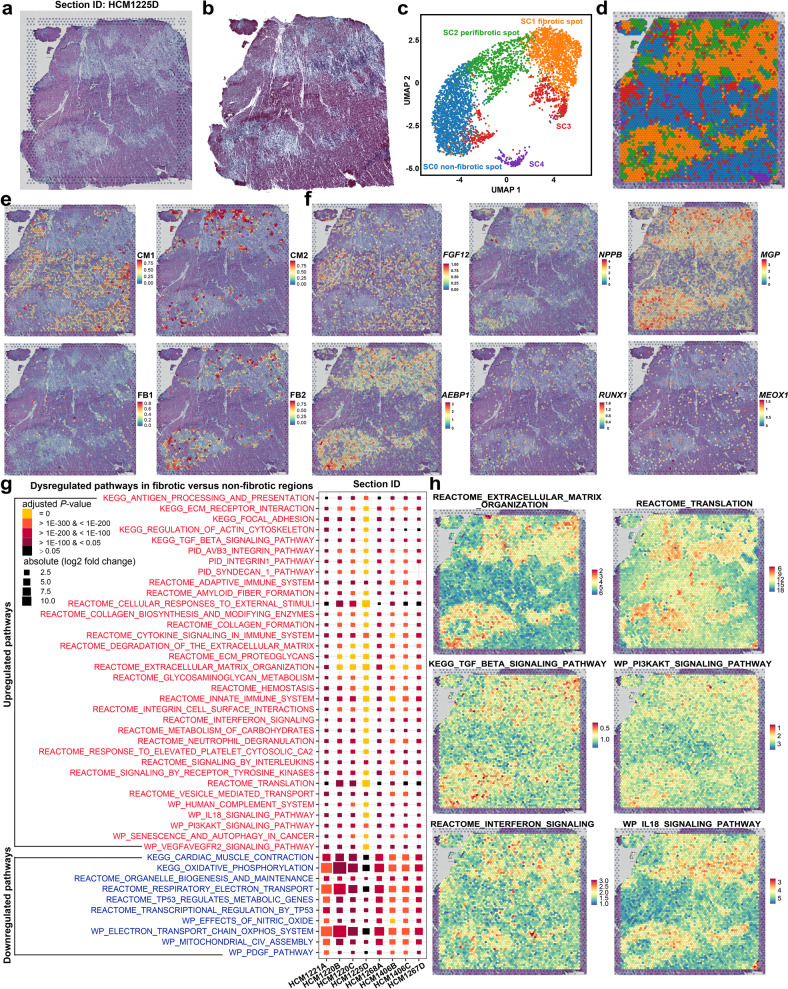
Fig. 6. Spatially resolved determination of the expression of candidate genes, the activity of HCM-related pathways, and the distribution of subpopulations by spatial transcriptomics.
a H&E staining image for the cardiac tissue section HCM1225D. b Masson’s trichrome staining image of a section adjacent to HCM1225D. c UMAP plot showing the spot clusters identified using unbiased clustering of the spots on HCM1225D. d Distribution of the spot clusters on the HCM1225D section. e Spatial location of the subpopulations FB1, FB2, CM1, and CM2 on the HCM1225D section predicted by integrating snRNA-seq data and spatial transcriptomic data. f Expression distribution of representative markers and candidate target genes on the section HCM1225D. g Dysregulated pathways in fibrotic versus non-fibrotic regions of the cardiac tissue sections of HCM. The dysregulated pathways were identified based on the pathway activity scores of each spot using the Wilcoxon rank-sum test. The significance threshold was set to a Bonferroni-adjusted P-value < 0.05 and an absolute of the log2 fold change > 0.25. HCM1220B and HCM1220C are sections from different samples of the same patient; HCM1406B and HCM1406C are neighboring sections from the same patient. h Activity of representative upregulated pathways in fibrotic regions on the HCM1225D section.

