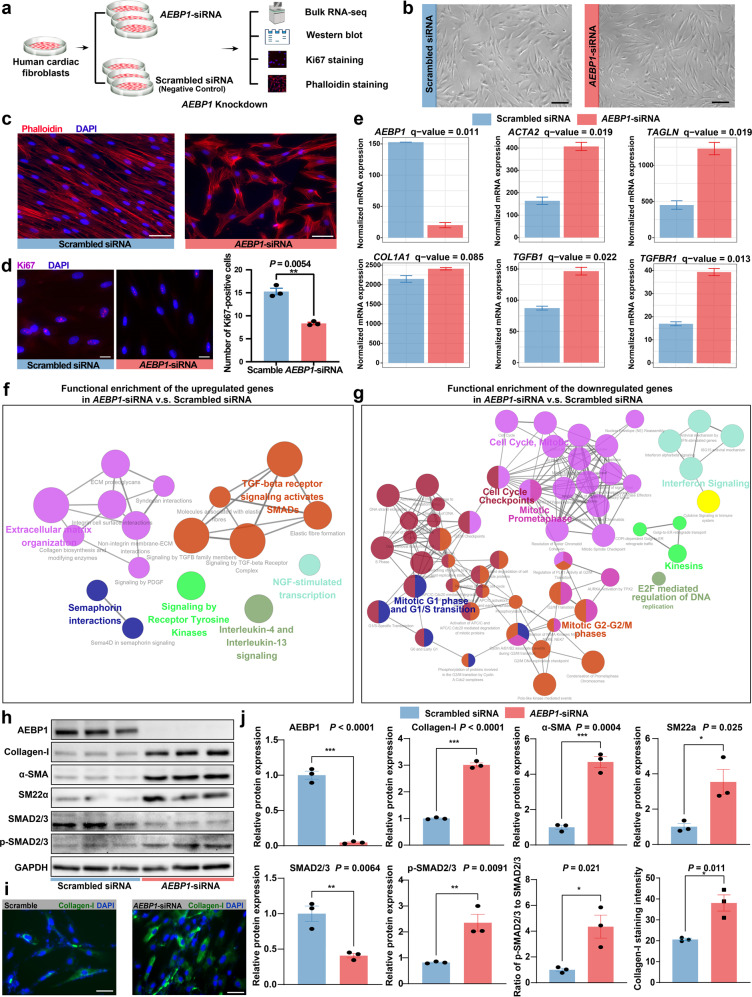
Fig. 7. In vitro knockdown of AEBP1 promotes the activation of human cardiac fibroblasts.
a Schematic diagram showing the experimental procedure of AEBP1 knockdown. Three independent experiments were performed for each group. Normal human ventricular cardiac fibroblasts (passage 5-7) were used. b Bright-field images showing the cardiac fibroblasts after 48 h of transfection. Scale bar: 200 μm. c Phalloidin staining of actin filaments showing the morphological changes of cardiac fibroblasts caused by AEBP1 knockdown. Scale bar: 50 μm. d Ki67 staining showing that AEBP1 knockdown reduced the proliferation of cardiac fibroblasts. In the bar plot, each value represents the mean number of Ki67-positive cells across five representative fields of view. Scale bar: 20 μm. **P-value < 0.01, Student’s t-test. e mRNA expression of AEBP1 and markers for fibroblast activation in both groups. The expression level is represented as tags per million reads. f Network plot showing the functional enrichment of the upregulated genes in AEBP1-siRNA versus scrambled siRNA. g Network plot showing the functional enrichment of the downregulated genes in AEBP1-siRNA versus scrambled siRNA. In f and g, each node denotes an over-represented Reactome pathway, and the node size reflects the statistical significance. Functionally associated terms were in the same color. The enrichment significant threshold was set to an adjusted P-value < 0.05. h Western blot assay showing the changes in protein expression of AEBP1 and representative fibroblast activation markers by the knockdown of AEBP1. i Immunofluorescence staining of cultured fibroblasts showing an increased protein expression level of Collagen-I by the knockdown of AEBP1. Scale bar: 50 μm. j Quantitative analysis of the western blot and staining results. For bar plots, the data are presented as means±standard error of the mean (SEM). For the staining results, each value represents the mean fluorescence intensity across five representative fields of view. *P-value < 0.05, **P-value < 0.01, ***P-value < 0.001. Student’s t-test.

