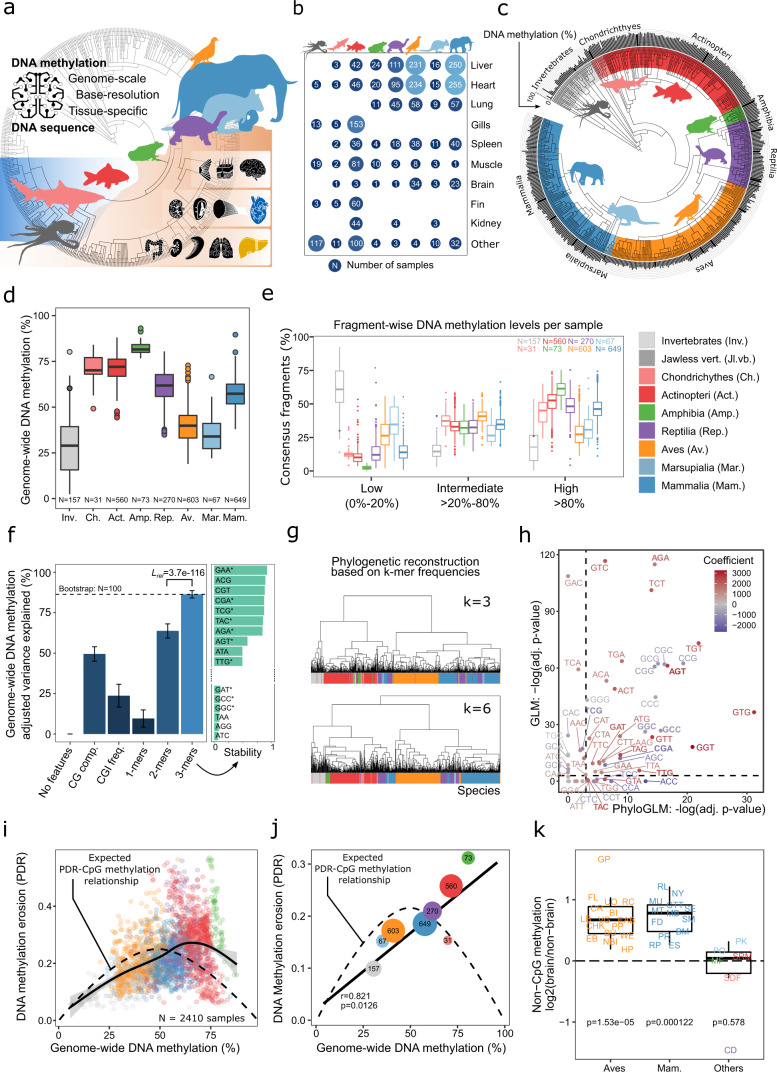
Fig. 1. An atlas of DNA methylation comprising 580 animal species reveals global links between genomes and epigenomes throughout vertebrate evolution.
a Visual summary of the study. The cross-species atlas comprises 2443 genome-scale DNA methylation profiles covering 580 animal species (535 vertebrates and 45 invertebrates). The animal silhouettes show one species per taxonomic group: Octopus (invertebrates), shark (cartilaginous fish), carp (bony fish), frog (amphibians), tortoise (reptilians), pigeon (birds), wallaby (marsupials), elephant (eutherian mammals). Organ silhouettes denote the main tissues included, organized by germ layer. b Bubble plot showing the number of analyzed samples for each tissue and taxonomic group. c Bar plot showing genome-wide DNA methylation levels for each species (black bars outside of the circle), averaged across all tissues and individuals, mapped onto an annotated taxonomic tree. d Boxplot showing genome-wide DNA methylation levels for all species, aggregated by taxonomic group. e Boxplot showing the percentage of consensus reference fragments for each species that fall into three bins based on their DNA methylation levels, aggregated by taxonomic group. Fragments covered by at least 10 reads were included. f Left: Bar plot showing the percentage of variance among species-specific mean DNA methylation levels explained by features of the genomic DNA sequence. Colors indicate the mean Akaike information criterion (AIC), adjusting for model complexity. Error bars represent standard deviations of the mean based on bootstrapping (100 iterations). Right: Bar plot showing the stability with which individual 3-mers were selected into the final model using stepwise selection. Stars indicate that the respective 3-mers show a statistically significant association based on the phylogenetic generalized linear model depicted in panel h. g Hierarchical clustering of species based on the similarity of their 3-mer and 6-mer frequencies among the consensus reference fragments. Clustering for k-mer lengths of four and five yielded very similar results and is not shown here. The dendrograms are color-coded with each species’ taxonomic group. h Scatterplot comparing the statistical significance (p-values) of the associations between 3-mer frequencies and global DNA methylation levels based on the standard error of the generalized linear models (GLMs) with (x-axis) and without (y-axis) correction for phylogenetic relationships. The 3-mers from panel f are shown in bold. Dashed lines correspond to an adjusted p-value of 0.05. i Scatterplot showing the relationship between genome-wide DNA methylation levels and DNA methylation erosion as measured by the “proportion of discordant reads” (PDR) for individual samples. The dashed line represents their mathematically expected relationship. The solid line represents a generalized additive model fitted to the data using the R function geom_smooth. j Scatterplot showing the relationship between genome-wide DNA methylation levels and DNA methylation erosion across taxonomic groups, taking the median of the corresponding samples. The dashed line represents their mathematically expected relationship (as in panel i). The solid line represents a linear regression model fitted to the data. The Pearson correlation and its significance (two-sided) are indicated. k Boxplot showing log-ratios of non-CpG methylation levels in brain compared to other tissues in the same species. Boxplots are overlayed with individual data points using the species abbreviations (Supplementary Data 2). Increased non-CpG methylation levels in brain were assessed with a one-sided paired Wilcoxon test. Boxplots are specified as follows: center line, median; box limits, upper and lower quartiles; whiskers, 1.5x interquartile range; points, outliers.

