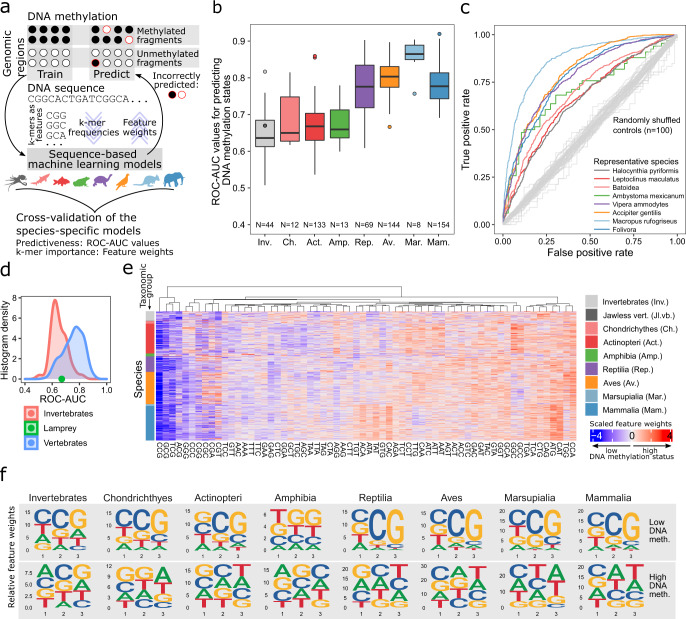
Fig. 2. Machine learning identifies a predictive relationship (“genomic code”) between the DNA sequence and locus-specific DNA methylation.
a Schematic illustration of the machine learning based approach for predicting locus-specific DNA methylation from the underlying genomic DNA sequence. b Boxplot showing the test set performance (receiver operating characteristic area under curve, ROC-AUC) of support vector machines (SVMs) predicting the DNA methylation status (high versus low) of individual genomic regions based on the k-mer frequencies of the corresponding genomic DNA sequence. c Representative ROC curves for each taxonomic group, selected such that the displayed species’ ROC-AUC values closely reflect the mean ROC-AUC values of the corresponding taxonomic group. As negative controls, ROC curves trained and evaluated on data with randomly shuffled labels fall close to the diagonal (in gray). d Histograms of ROC-AUC values for vertebrate and invertebrate species, with the lamprey (an early jawless vertebrate) shown as a green dot between the two distributions. e Heatmap displaying the feature weights of 3-mers based on SVMs trained to predict locus-specific DNA methylation from the underlying DNA sequence, separately for each species (ordered by the taxonomic tree). f Sequence logos visualizing averaged feature weights of 3-mers across species for each taxonomic group. Sequence logos are displayed separately for 3-mers associated with low and high DNA methylation levels. Boxplots are specified as follows: center line, median; box limits, upper and lower quartiles; whiskers, 1.5x interquartile range; points, outliers.

