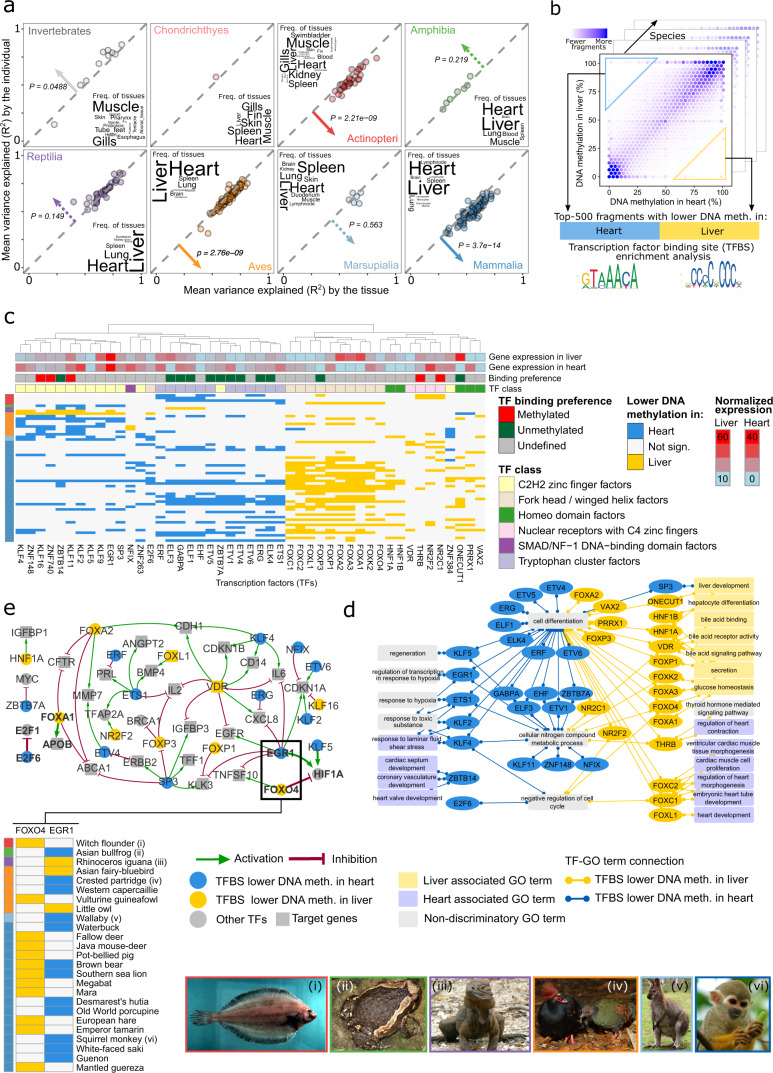
Fig. 4. Tissue-specific DNA methylation indicates deeply conserved associations of DNA methylation with transcription regulation and tissue identity.
a Scatterplots showing for each species the percentage of locus-specific DNA methylation variance that is explained by the tissue (x-axis) and by the individual (y-axis), separately for each taxonomic group. Arrows and p-values indicate the direction and statistical significance of the difference in the variance explained by tissue and individual, calculated using a two-sided pairwise Wilcoxon test. Dashed arrows indicate non-significant differences. Word clouds summarize the frequency of tissue types that contributed to the analysis in each taxonomic group. b Schematic illustration of the enrichment analysis for transcription factor binding site (TFBS) motifs among the differentially methylated regions identified between heart and liver (within a given species). c Clustered heatmap showing TFBS motif enrichments for differentially methylated fragments between heart and liver. For each transcription factor (columns), colors indicate whether it was enriched in fragments that were hypomethylated in heart (blue) or liver (yellow) in the corresponding species (rows). This heatmap includes only those transcription factors and species that had a minimum of ten significant enrichments per species, and normalized RNA expression values greater than one in either heart or liver tissues according to the Human Protein Atlas. d Visualization of the Gene Ontology annotations of the transcription factors identified in panel c. e Gene-regulatory network constructed based on the transcription factors identified in panel c with known binding preference (methylated/unmethylated) and their direct target genes with known regulatory effect (activation: green; repression: red). Transcription factors that were preferentially hypomethylated in one tissue type were colored in yellow (heart) or blue (liver), while those that did not show such an enrichment, as well as the transcription factor target genes, were colored in gray. The inset shows specific enrichments for FOXO4 and EGR1 in heart and liver, which have opposing effects on HIF1A (FOXO4: activation; EGR1: repression). The pictures at the bottom show one species for each taxonomic group that contributed to this cross-species analysis of DNA methylation differences in heart and liver.

