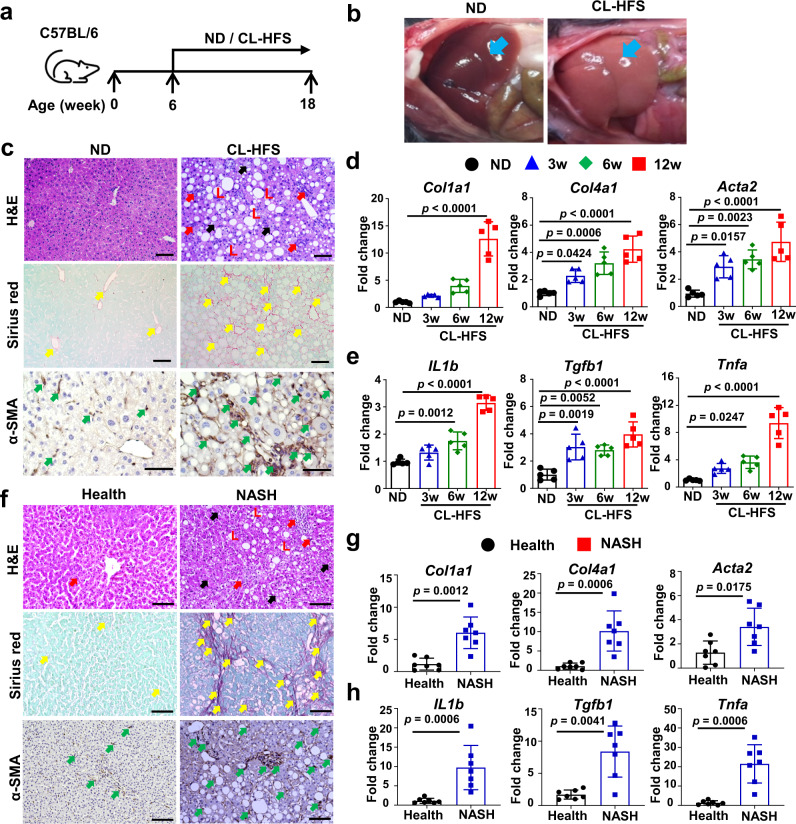
Fig. 1. Establishment and characterization of a mouse NASH model.
a An outline depicting induction of NASH with a CL-HFS. Six-week-old WT C57BL/6 J mice were fed a CL-HFS or normal diet (ND) for 12 weeks. At week 18, each mouse was euthanized for the following studies. b Representative macroscopic images of livers in CL-HFS- and ND-fed mice. c Representative histological images of liver tissues. Typical hepatic features of NASH were detected in CL-HFS-fed mice in comparison to ND-fed mice: H&E staining showed lipid deposition (L), hepatocytes ballooning (black arrow), and inflammatory cell liver infiltration (red arrow); Sirius red staining showed increased production of collagen (yellow arrows); IHC showed increased production of α-SMA (green arrows). Bar: 50 μm. d qPCR measurement of mRNA expression of extracellular matrix (ECM) genes Col1a1, Col4a1, and Acta2; e qPCR measurement of mRNA expression of proinflammatory cytokine genes IL1b, Tgfb1, and Tnfa in the livers of ND-fed and CL-HFS-fed mice at the indicated time points. For d and e, n = 5, data are presented as mean ± SD. f Representative histological images of liver tissues in healthy individuals and patients with NASH. Compared to healthy individuals, NASH caused lipid deposition (L), hepatocyte ballooning (black arrow), and inflammatory cell liver infiltration (red arrow) assessed by H&E staining; increased production of collagen measured by Sirius red staining (yellow arrows), and enhanced production of α-SMA (green arrows) measured by IHC. Bar: 100 μm. g mRNA expression of ECM genes in human livers. qPCR detected increased gene expression of Col1a1, Col4a1, and Acta2 in the livers of patients with NASH compared to those of healthy individuals. h mRNA expression of proinflammatory cytokines in human livers. qPCR detected the increased gene expression of IL1b, Tgfb1, and Tnfa in the livers of patients with NASH compared to healthy individuals. For g and h, n = 7, data are presented as mean ± SD. Statistical analysis of data was performed by one-way ANOVA with Tukey’s multiple comparison test (≥3 groups) or Mann–Whitney test (two-tailed) using GraphPad Prism 8 software. Source data are provided as a Source Data file.

